
Getting Started with Minitab Statistical
Software

Contents
1 Introduction 4
Overview 4
The story 4
The Minitab user interface 4
Data types 6
Open and examine a worksheet 7
In the next chapter 7
2 Graphing Data 8
Overview 8
Create, interpret, and edit histograms 8
Create and interpret scatterplots 13
Arrange multiple graphs on one layout 16
Save a Minitab project 19
In the next chapter 20
3 Analyzing Data 21
Overview 21
Summarize the data 21
Compare two or more means 23
Save the project 29
In the next chapter 29
4 Assessing Quality 30
Overview 30
Create and interpret control charts 30
Create and interpret capability statistics 35
Save the project 36
In the next chapter 36
5 Designing an Experiment 37
Overview 37
Create a designed experiment 37
View the design 40
Enter data into the worksheet 41
Analyze the design and interpret the results 42
Use the stored model for additional analyses 45
Save the project 48
In the next chapter 49
6 Repeat an Analysis 50
Overview 50
Perform an analysis using session commands 50
minitab.com 2
Getting Started with Minitab Statistical Software

Copy session commands 51
Use an exec file to repeat the analysis 52
Save the project 53
In the next chapter 54
7 Importing and Preparing Data 55
Overview 55
Import data from different sources 55
Prepare the data for your analysis 57
When data values change 60
Save the worksheet 60
Index 61
minitab.com 3
Getting Started with Minitab Statistical Software

1. Introduction
Overview
Getting Started with Minitab Statistical Software introduces you to some of the most commonly used features and tasks
in Minitab.
Note: Some features in this guide are only available in the desktop app. When you use the web app, you can open the desktop app to access
all of the features that Minitab offers.
Most statistical analyses require that you follow a series of steps, often directed by background knowledge or by the
subject area that you are investigating. Chapters 2 through 5 illustrate the following steps:
•
Explore data with graphs and present results
•
Conduct statistical analyses
•
Assess quality
•
Design an experiment
In chapters 6 and 7, you learn to do the following:
•
Use shortcuts to automate future analyses
•
Import data into Minitab from different file types and prepare the data for analysis
The story
A company that sells books online has three regional shipping centers. Each shipping center uses a different computer
system to enter and process orders. The company wants to identify the most efficient computer system and to use that
computer system at each shipping center.
Throughout Getting Started with Minitab Statistical Software, you analyze data from the shipping centers as you learn to
use Minitab. You create graphs and perform statistical analyses to identify the shipping center that has the most efficient
computer system. You then concentrate on the data from this shipping center. First, you create control charts to test
whether the shipping center’s process is in control. Then, you perform a capability analysis to test whether the process
is operating within specification limits. Finally, you perform a designed experiment to determine ways to improve those
processes.
You also learn how to use session commands to automate future analyses and how to import data into Minitab.
The Minitab user interface
Everything you see in the Minitab interface is part of your project.
minitab.com 4
Getting Started with Minitab Statistical Software
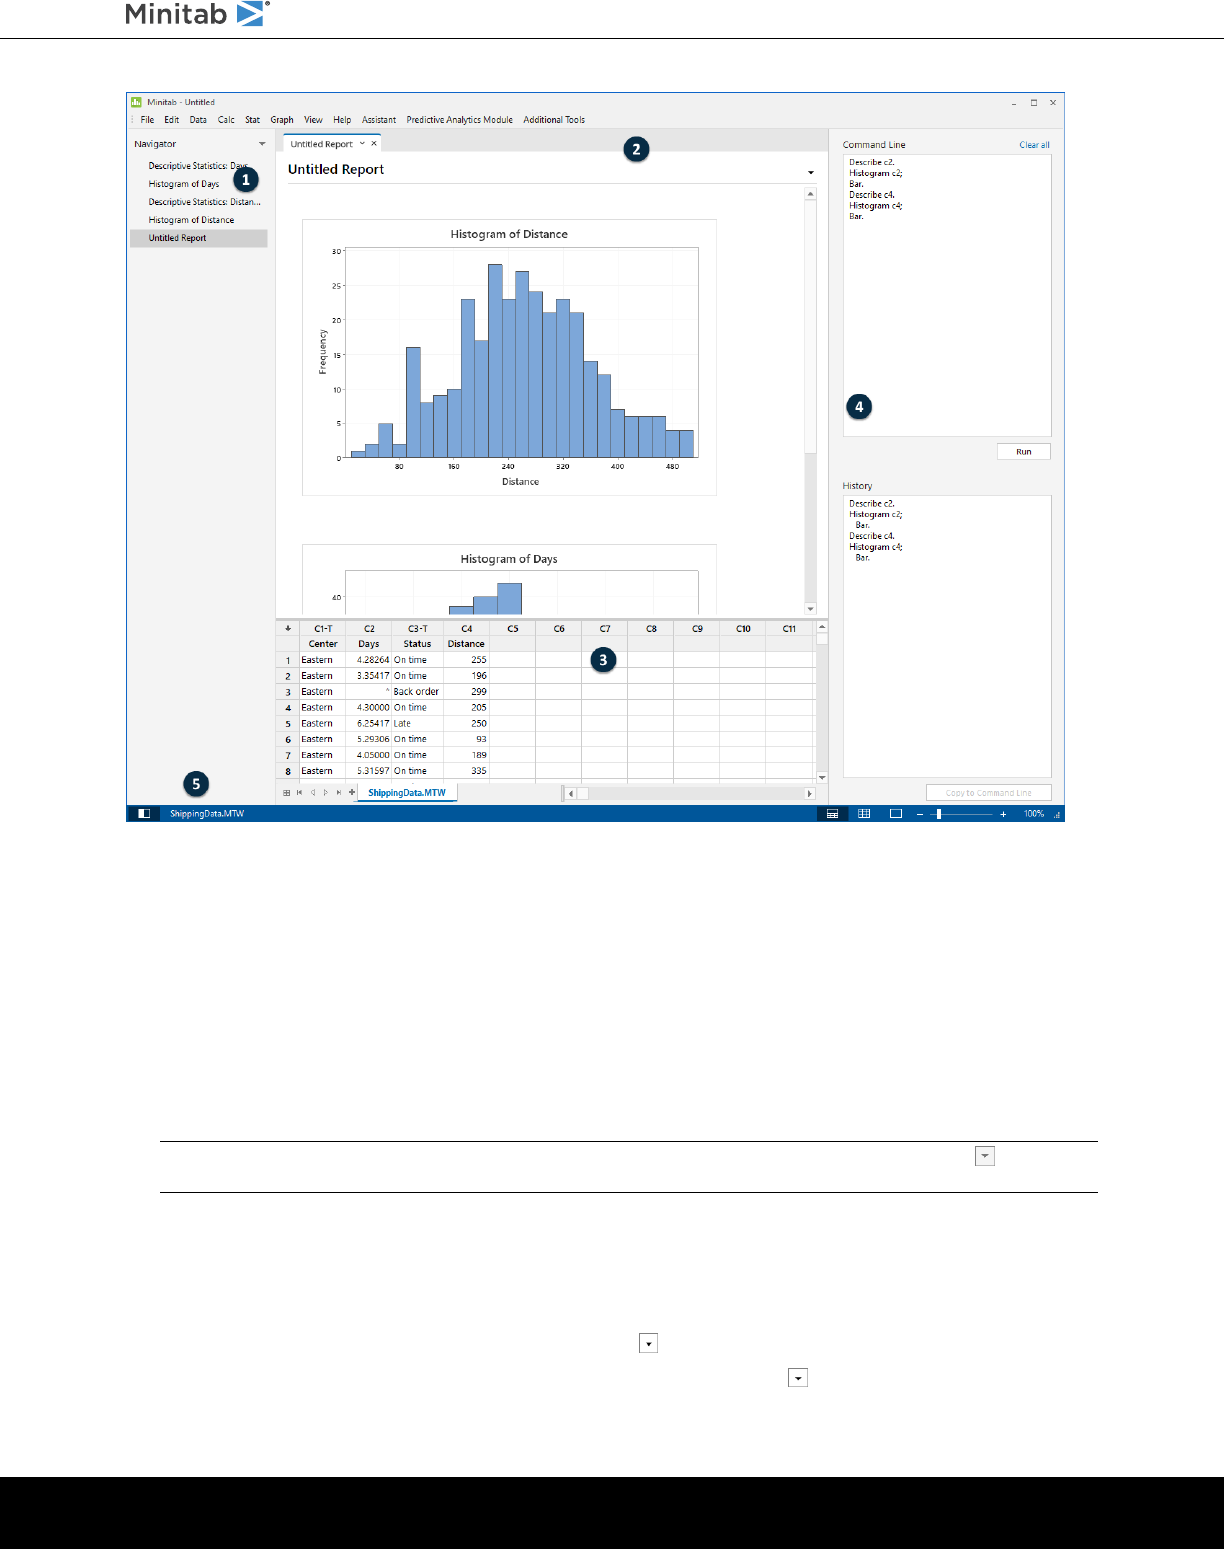
The Minitab interface includes the following components:
1: Navigator
Contains the list of output titles and report titles in your project. The output and reports are sorted from oldest to
newest, with the most recent items at the bottom of the list. Right-click any title in the Navigator to do the following
tasks:
•
Open the output or the report in split view to compare outputs and to easily drag and drop output into a report.
•
Rename the output or the report. The name is also updated in the output pane.
•
Send the output or the report to a different application, such as Microsoft
®
Word, Microsoft
®
PowerPoint, Minitab
Engage
®
, or Minitab Workspace
®
.
•
Delete the analysis or the report from the project. You can undo this action from the Edit menu.
Tip: If your project has multiple worksheets, you can view the list of output by worksheet. From the Navigator, click and choose
Group Commands by Worksheet
2: Output pane
Displays a list of the output pages and report pages in a project. Output pages display output such as graphs or
tables after you run an analysis. Report pages display output that you collect from one or more output pages. From
the output pane, you can do the following tasks:
•
To affect the contents of a tab, click the tab, then click next to the output title.
•
To affect a specific table or graph, click the graph or the table, then click .
minitab.com 5
Getting Started with Minitab Statistical Software
•
To view output that is not currently visible, click the title of the output in the Navigator.
Tip: To compare the output of two different analyses or reports, right-click the second piece of output in the Navigator and choose
Open in Split View.
3: Data pane (worksheets)
Displays the active worksheet. You can have multiple worksheets in the data pane; however, Minitab uses the data
in the active worksheet to run the analysis.
Tip: To rename a worksheet, double-click the name in the worksheet tab.
4: Command Line/History pane
By default, this pane is not shown. To show this pane, choose View > Command Line/History. If you close Minitab
while the pane is visible, the pane is visible the next time you open Minitab.
Command Line
The location where you can enter or paste command language to perform an analysis.
History
The command language that Minitab uses to run an analysis. You can select and copy commands and
subcommands from the History pane to the Command Line pane, where you can edit and run them again.
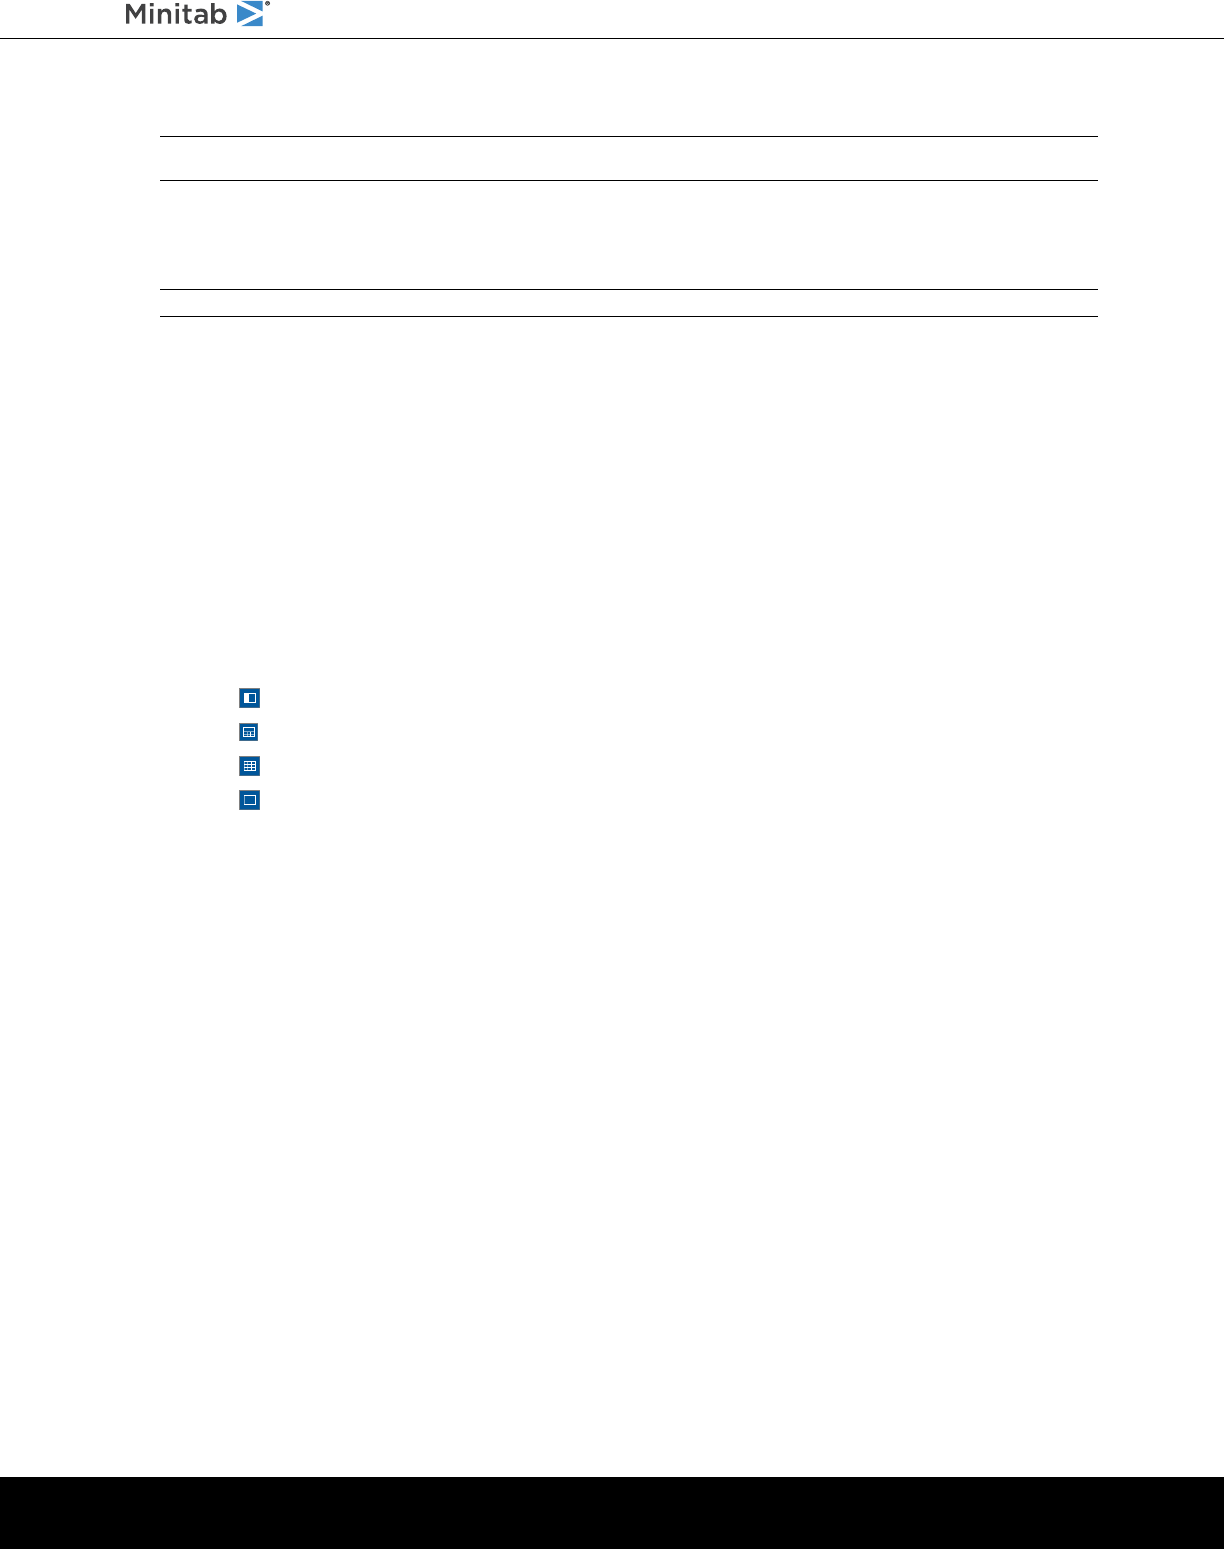
5: Status bar
Use the status bar to show or hide the Navigator, the data pane, or the output pane. You can also zoom in or zoom
out on a graph or a worksheet, depending on whether the data pane or the output pane is selected.
•
Click to show or hide the Navigator.
•
Click to show the output pane and the data pane at the same time.
•
Click to show only the data pane.
•
Click to show only the output pane.
Data types
A worksheet can contain the following types of data.
Numeric data
Numbers, such as 264 or 5.28125.
Text data
Letters, numbers, spaces, and special characters, such as Test #4 or North America.
Date/time data
Dates, such as Mar-17-2020, 17-Mar-2020, 3/17/20, or 17/03/20.
Times, such as 08:25:22 AM.
Date/time, such as 3/17/20 08:25:22 AM or 17/03/20 08:25:22.
minitab.com 6
Getting Started with Minitab Statistical Software
Open and examine a worksheet
You can open a new, empty worksheet at any time. You can also open one or more files that contain data, such as a
Microsoft
®
Excel file. When you open a file, you copy the contents of the file into the current Minitab project. Any changes
that you make to the worksheet while you are in the project do not affect the original file.
The data for the three shipping centers are stored in the worksheet, ShippingData.MTW.
Note: In some cases, you need to prepare your worksheet before you begin an analysis. For more information, go to Importing and Preparing
Data on page 55.
1. Open the data set, ShippingData.MTW.
The data are arranged in columns, which are also called variables. The column number and name are at the top of each
column.
C6C5-TC4C3-DC2-DC1-T
DistanceStatusDaysArrivalOrderCenter
255On time4.282643/8 15:213/4 8:34Eastern1
196On time3.354173/7 17:053/4 8:35Eastern2
299Back order**3/4 8:38Eastern3
205On time4.300003/8 15:523/4 8:40Eastern4
250Late6.254173/10 14:483/4 8:42Eastern5
In the worksheet, each row represents a single book order. The columns contain the following information:
•
Center: shipping center name
•
Order: order date and time
•
Arrival: delivery date and time
•
Days: delivery time in days
•
Status: delivery status
◦
On time indicates that the book shipment was received on time.
◦
Back order indicates that the book cannot be shipped yet because it is not currently in stock.
◦
Late indicates that the book shipment was received six or more days after the order was placed.
•
Distance: distance from the shipping center to the delivery location
In the next chapter
Now that you have a worksheet open, you are ready to start using Minitab. In the next chapter, you use graphs to check
the data for normality and examine the relationships between variables.
minitab.com 7
Getting Started with Minitab Statistical Software
2. Graphing Data
Overview
Before you perform a statistical analysis, you can use graphs to explore data and assess relationships between the
variables. Also, you can use graphs to summarize data and to help interpret statistical results.
You can access Minitab’s graphs from the Graph and Stat menus. Built-in graphs, which help you interpret results and
assess the validity of statistical assumptions, are also available with many statistical commands.
Minitab graphs include the following features:
•
Pictorial galleries to help you choose a graph type
•
Flexibility in customizing graphs
•
Graph elements that you can change
•
Option to be updated
This chapter explores the shipping data worksheet that you opened in the previous chapter. You use graphs to check
normality, compare means, explore variability, and examine the relationships between variables.
Create, interpret, and edit histograms
Before you perform a statistical analysis, first create graphs that display important characteristics of the data. For the
shipping data, you want to know the mean delivery time for each shipping center and how the data vary within each
shipping center. You also want to determine whether the shipping data follow a normal distribution, so that you can use
standard statistical methods for testing the equality of means.
Create a paneled histogram
To determine whether the shipping data follow a normal distribution, create a paneled histogram of the time lapse between
order date and delivery date.
Note: When you use the web app, click Open in Desktop App to complete the following steps.
1. If you are continuing from the previous chapter, go to step 2. If not, open the data set, ShippingData.MTW.
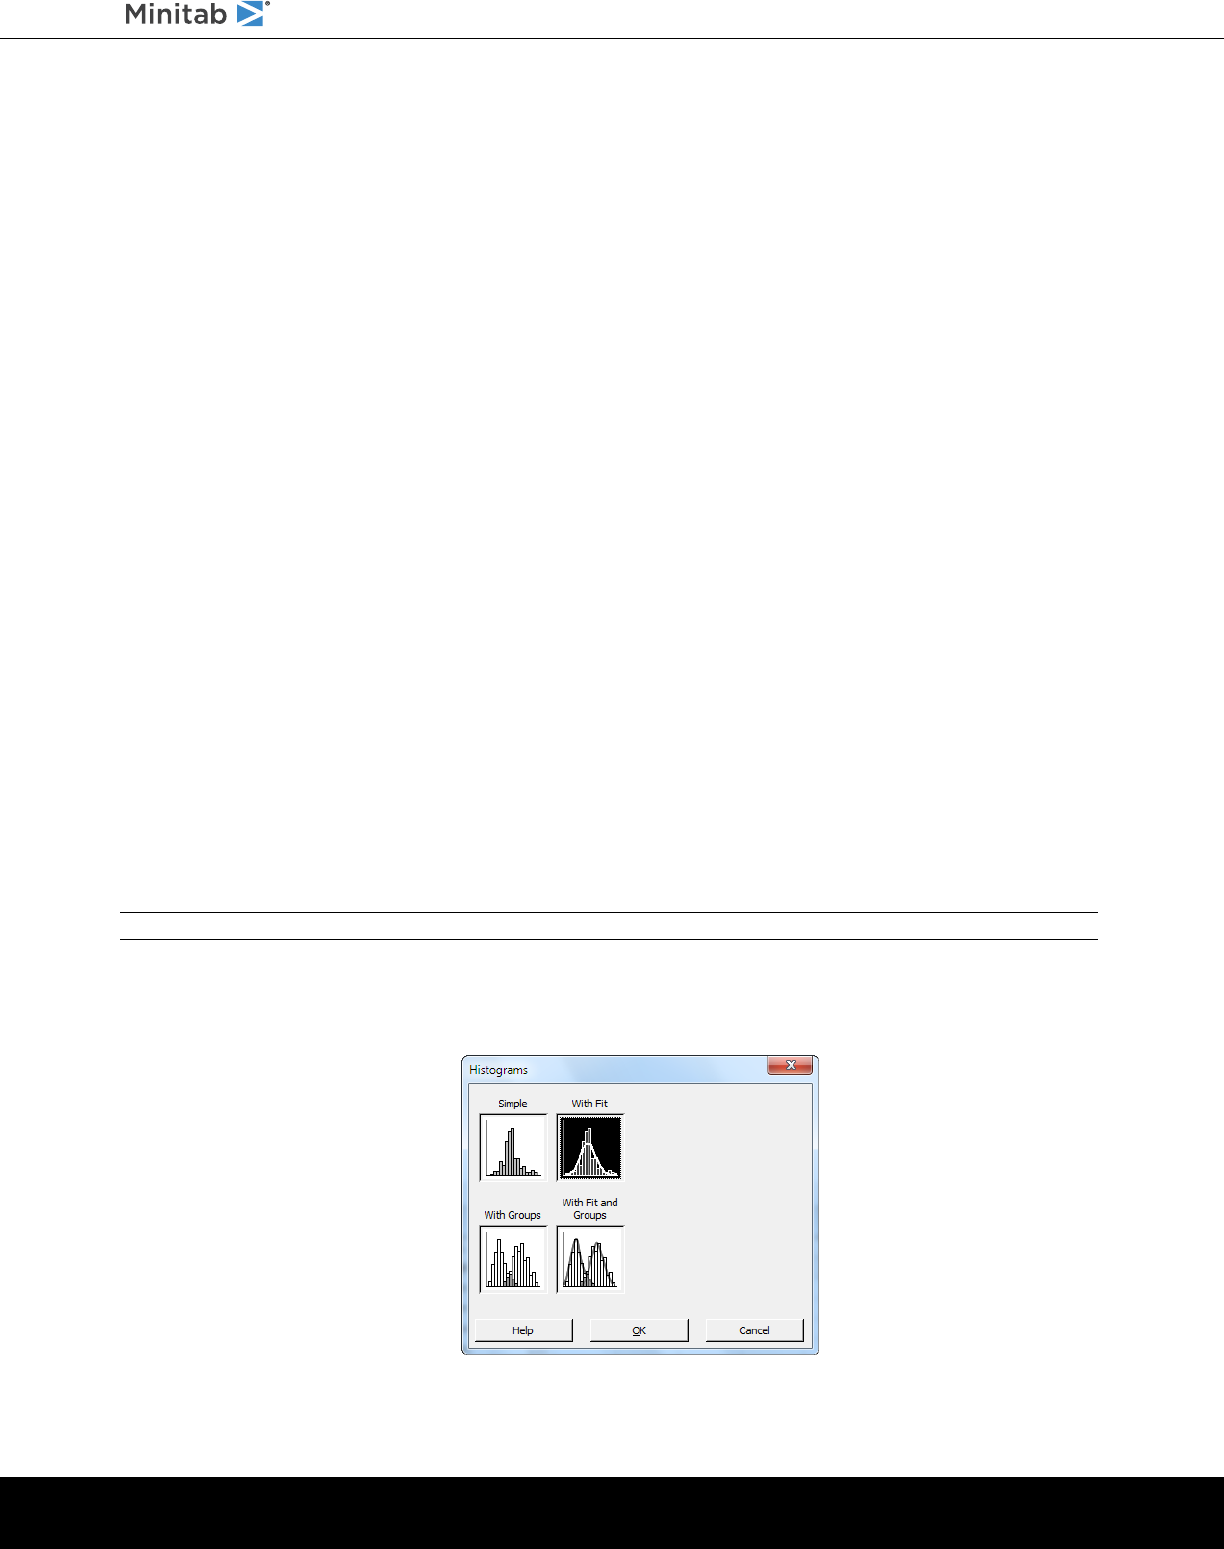
2. Choose Graph > Histogram.
minitab.com 8
Getting Started with Minitab Statistical Software
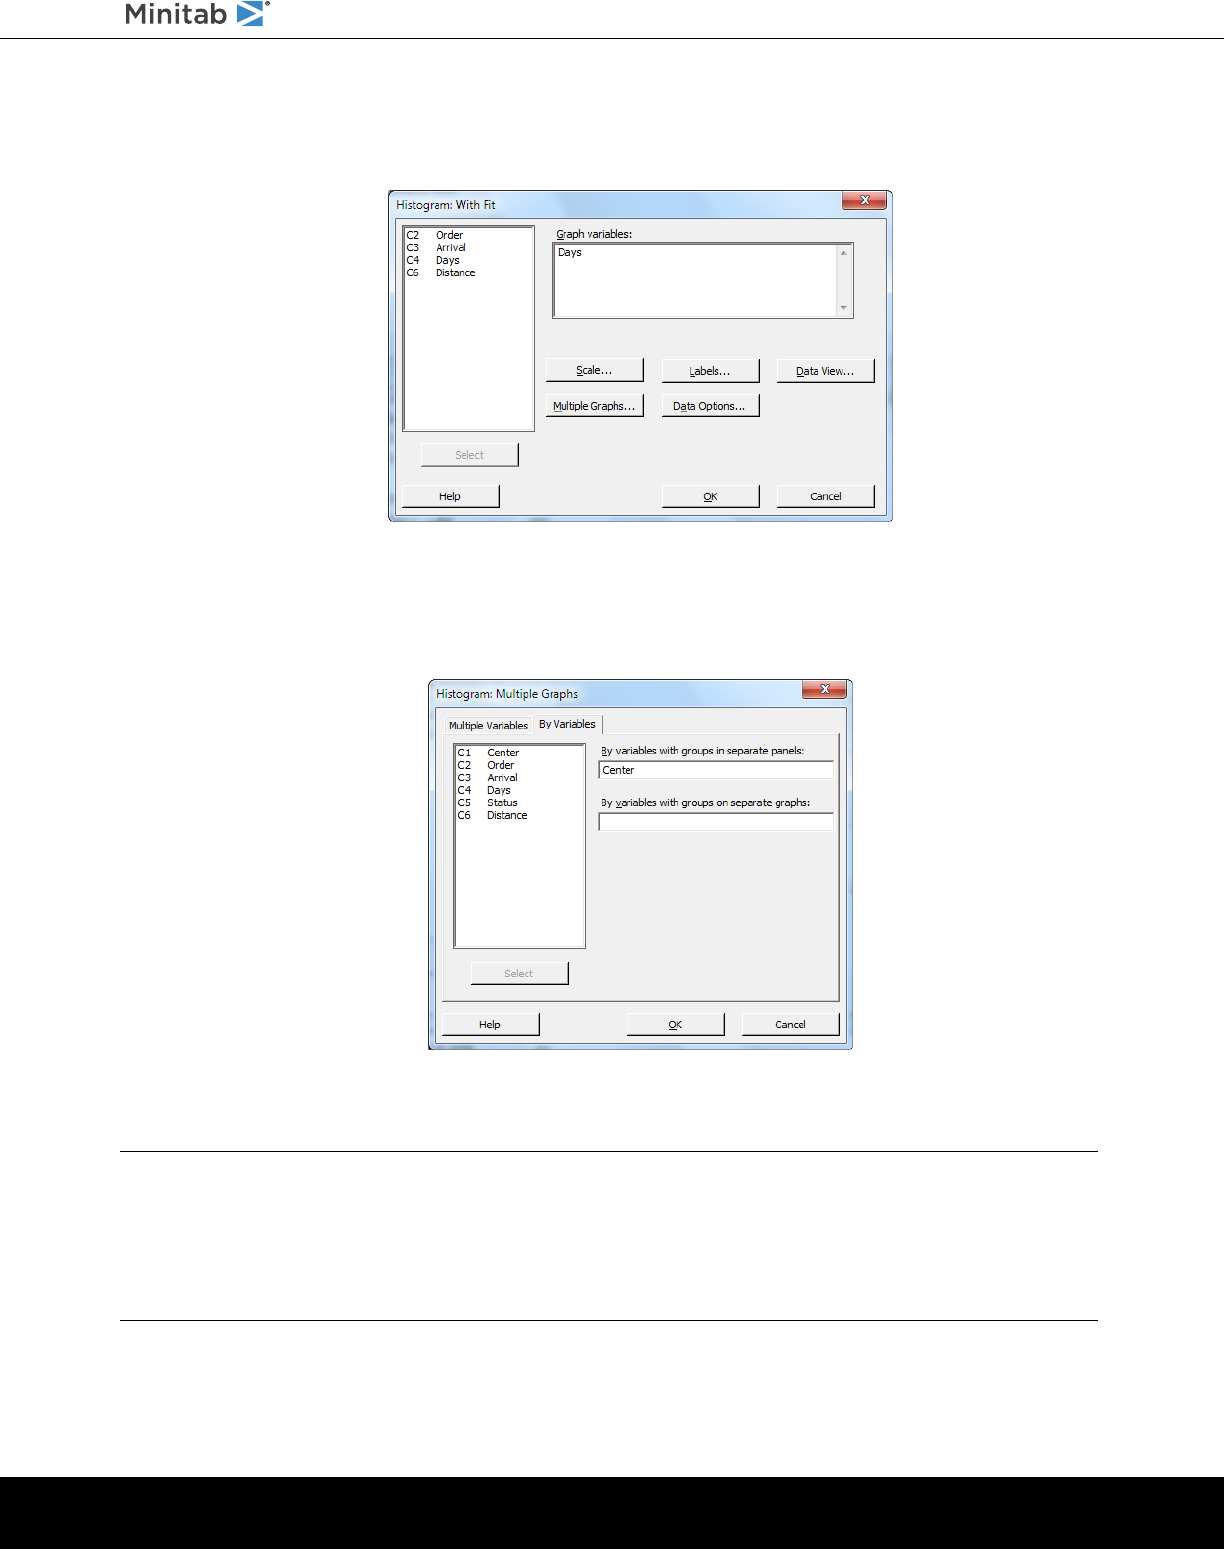
3. Choose With Fit, and then click OK.
4. In Graph variables, enter Days.
5. Click Multiple Graphs, and then click the By Variables tab.
6. In By variables with groups in separate panels, enter Center.
7. Click OK in each dialog box.
Note:
To select variables in most Minitab dialog boxes, use one of the following methods:
•
Double-click the variables in the variables list box.
•
Highlight the variables in the list box, and then click Select.
•
Type the variables’ names or column numbers.
minitab.com 9
Getting Started with Minitab Statistical Software
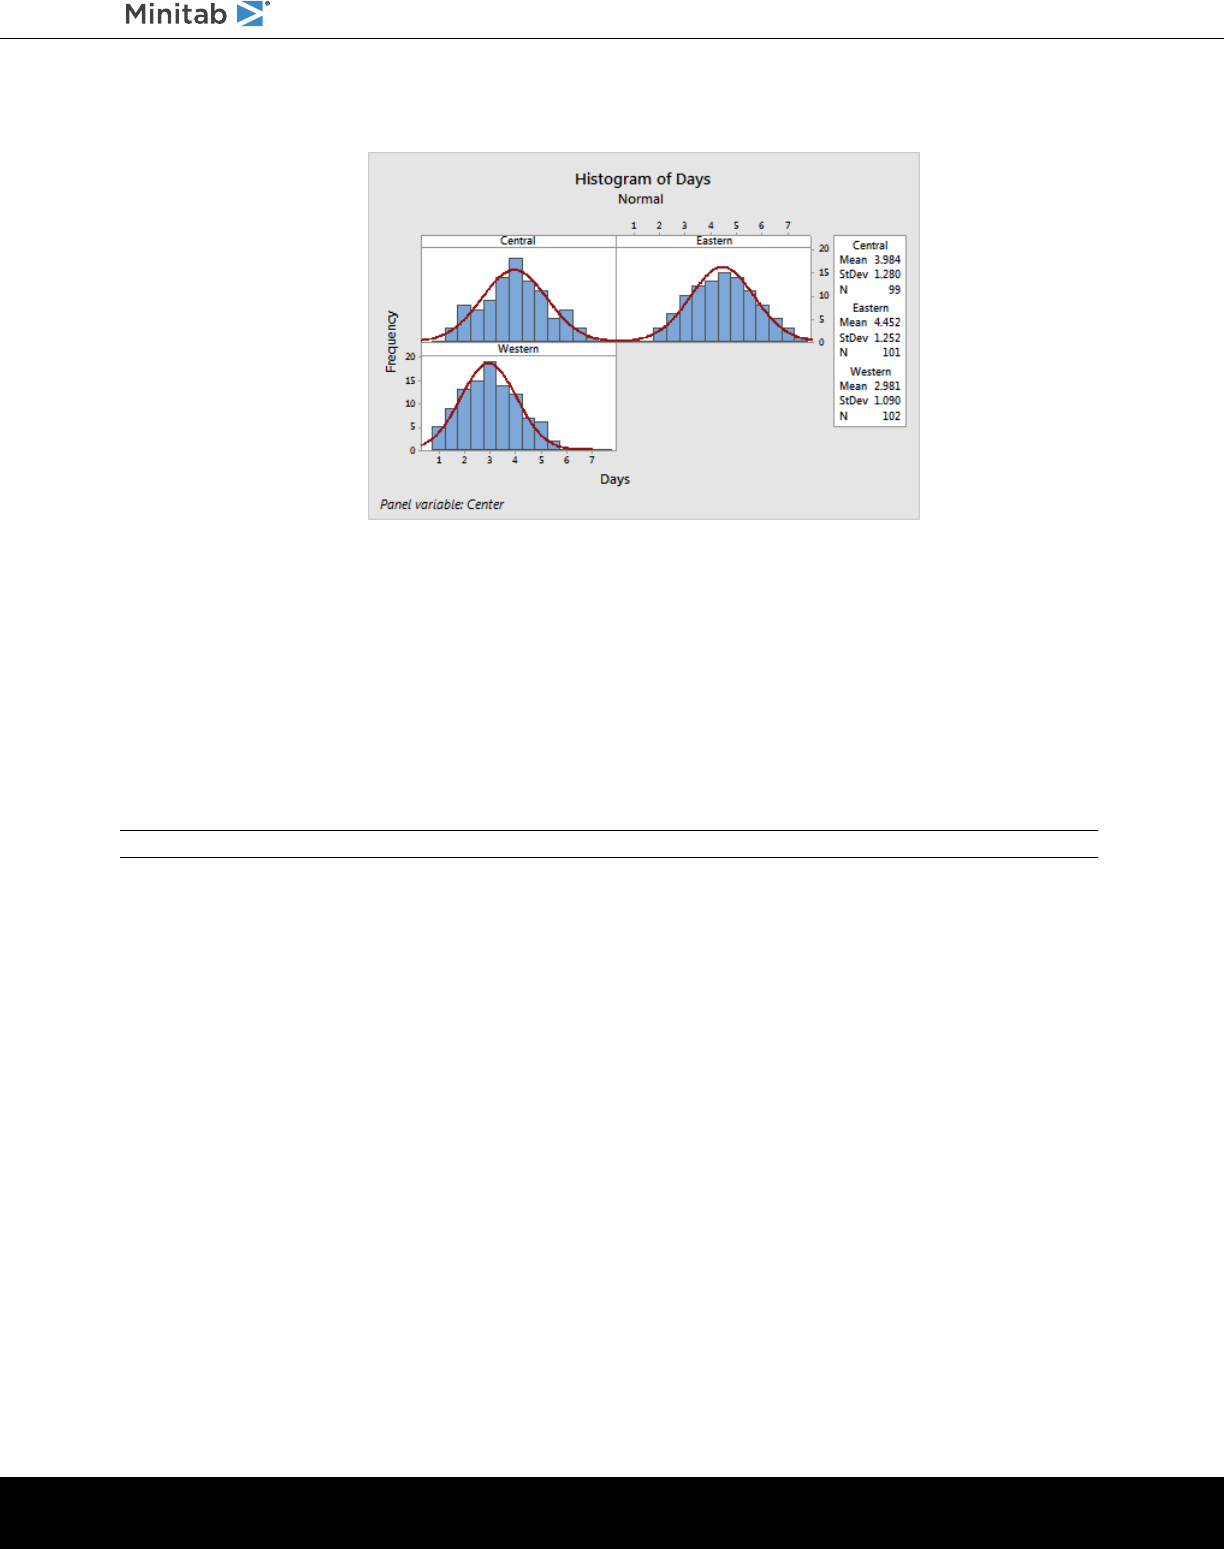
Histogram with groups in separate panels
Interpret the results
The histograms seem to be approximately bell-shaped and symmetric about the means, which indicates that the delivery
times for each center are approximately normally distributed.
Rearrange the paneled histogram
For the graph that you created, you want to rearrange the three panels so that comparisons among the means and
variations are easier.
Note: When you use the web app, click Open in Desktop App to complete the following steps.
1. Double-click the histogram to open the Edit Graph dialog box.
2. Right-click any of the histogram titles (Central, Eastern, or Western) and choose Edit Panels.
3. On the Arrangement tab, in Rows and Columns, select Custom. In Rows, enter 3. In Columns, enter 1.
4. Click OK in each dialog box to show the changes in the output pane.
minitab.com 10
Getting Started with Minitab Statistical Software

Histogram with panels arranged in one column
Interpret the results
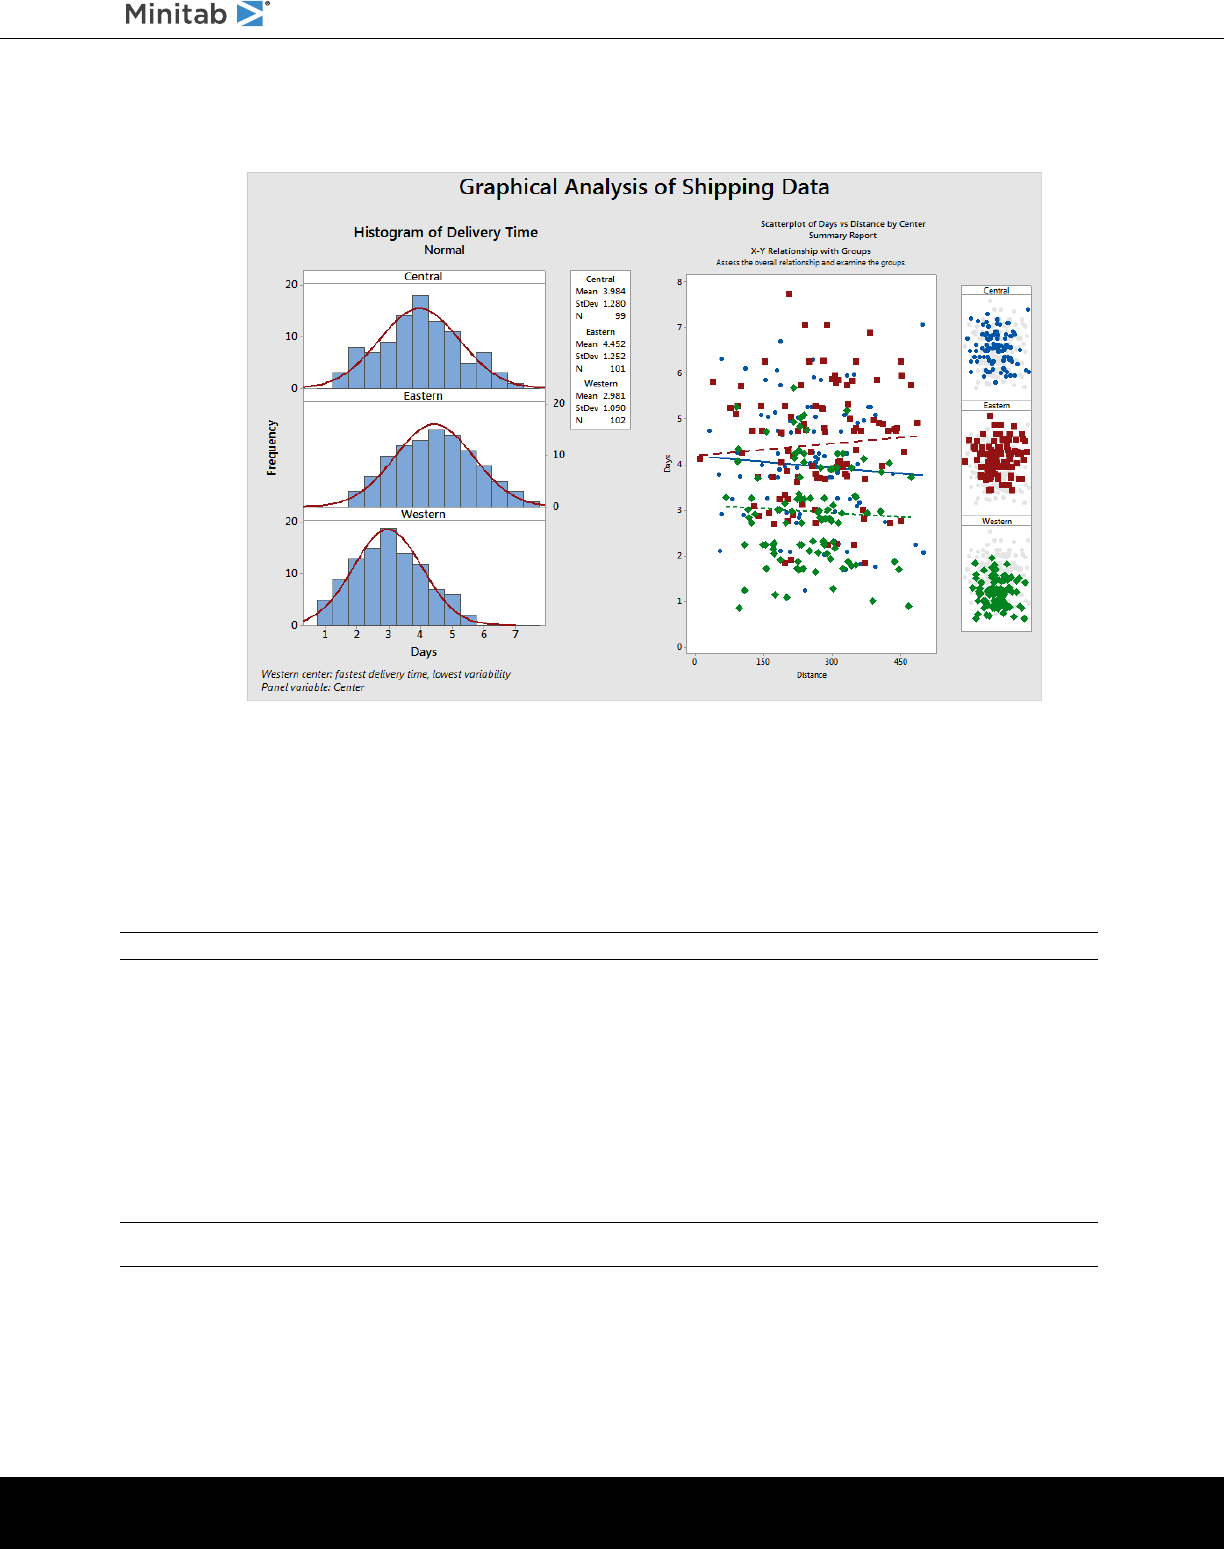
The mean delivery times for each shipping center are different:
•
Central: 3.984 days
•
Eastern: 4.452 days
•
Western: 2.981 days
The histogram shows that the Central and Eastern centers are similar in both mean delivery time and spread of delivery
time. In contrast, the mean delivery time for the Western center is shorter and the distribution is less spread out. Analyzing
Data on page 21 shows how to detect statistically significant differences between means using ANOVA (analysis of
variance).
Tip: With some graphs and output, such as the histogram, Minitab notifies you when data in the worksheet have changed. When data change,
look for the notification at the top of the output pane, then click one of the links to update the results or create new results using the current
data.
Edit the title and add a footnote
To help your supervisor quickly interpret the histogram, you want to change the title and add a footnote.
Note: When you use the web app, click Open in Desktop App to complete the following steps.
1. Double-click the histogram to open the Edit Graph dialog box.
2. Double-click the title, Histogram of Days.
minitab.com 11
Getting Started with Minitab Statistical Software
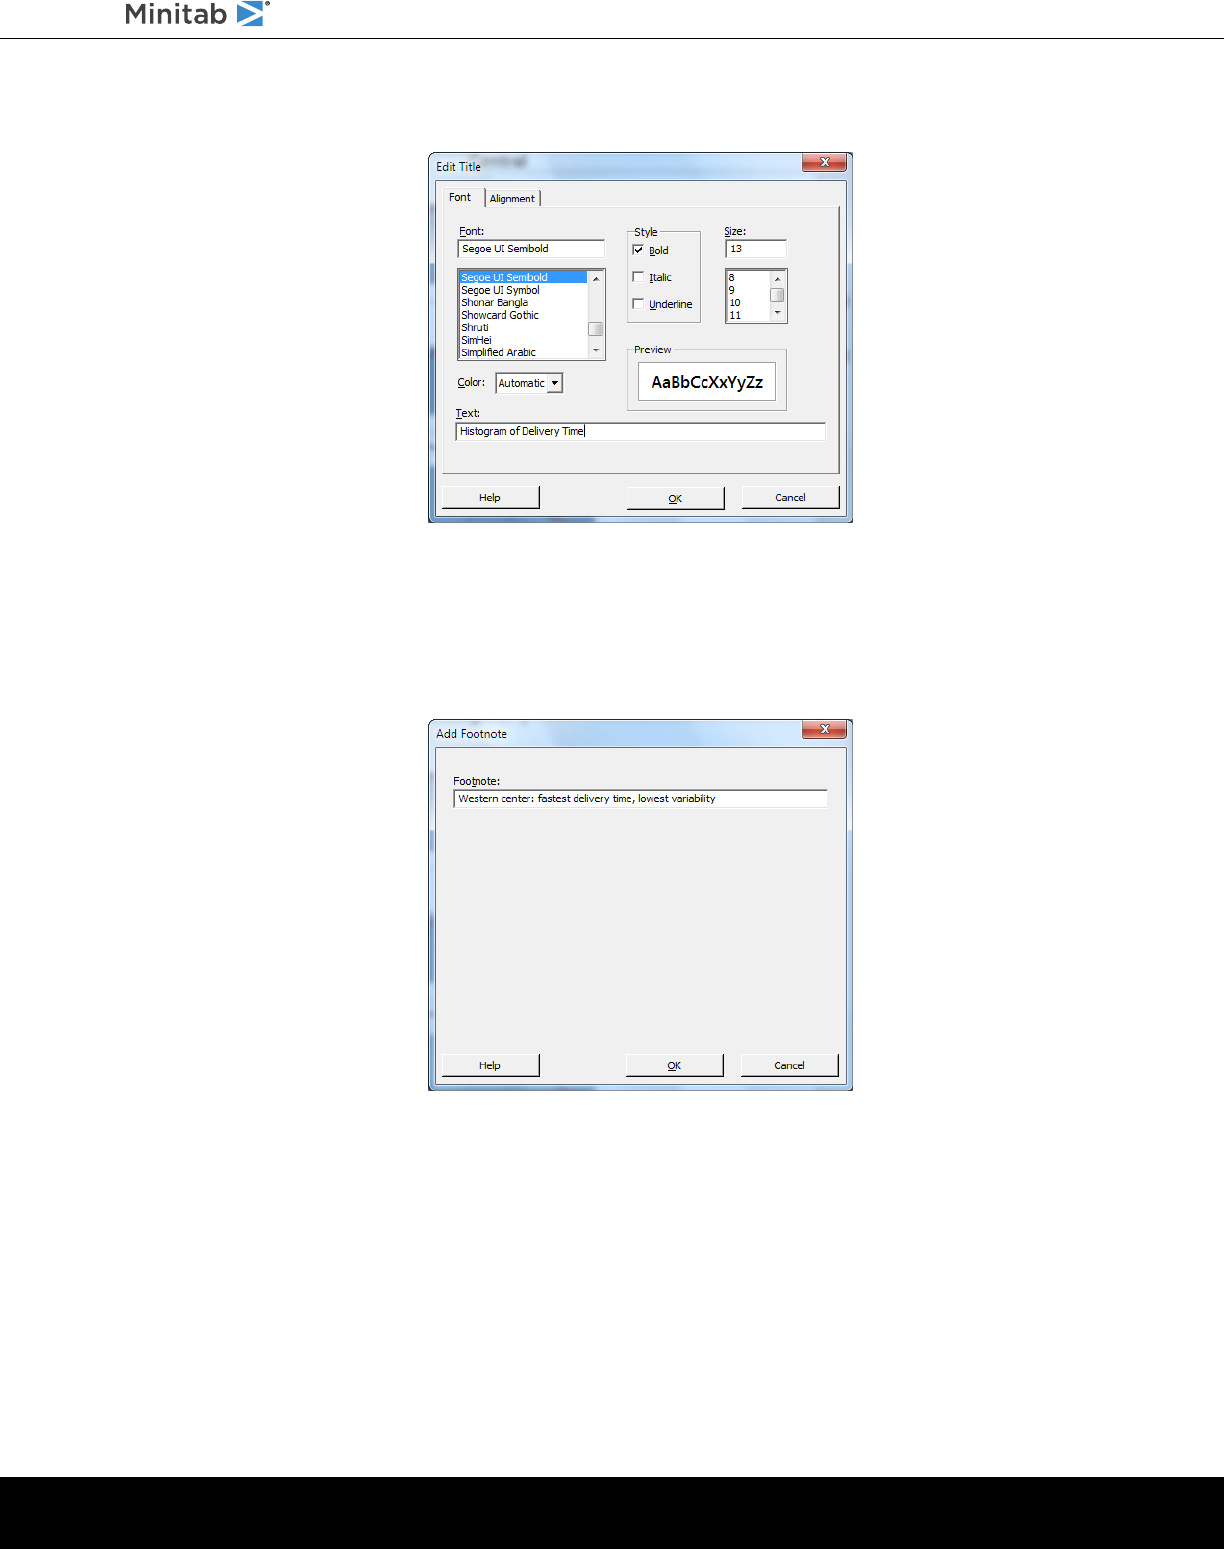
3. In Text, enter Histogram of Delivery Time.
4. Click OK.
5. Right-click the histogram, and then choose Add > Footnote.
6. In Footnote, enter Western center: fastest delivery time, lowest variability.
7. Click OK in each dialog box to show the changes in the output pane.
minitab.com 12
Getting Started with Minitab Statistical Software
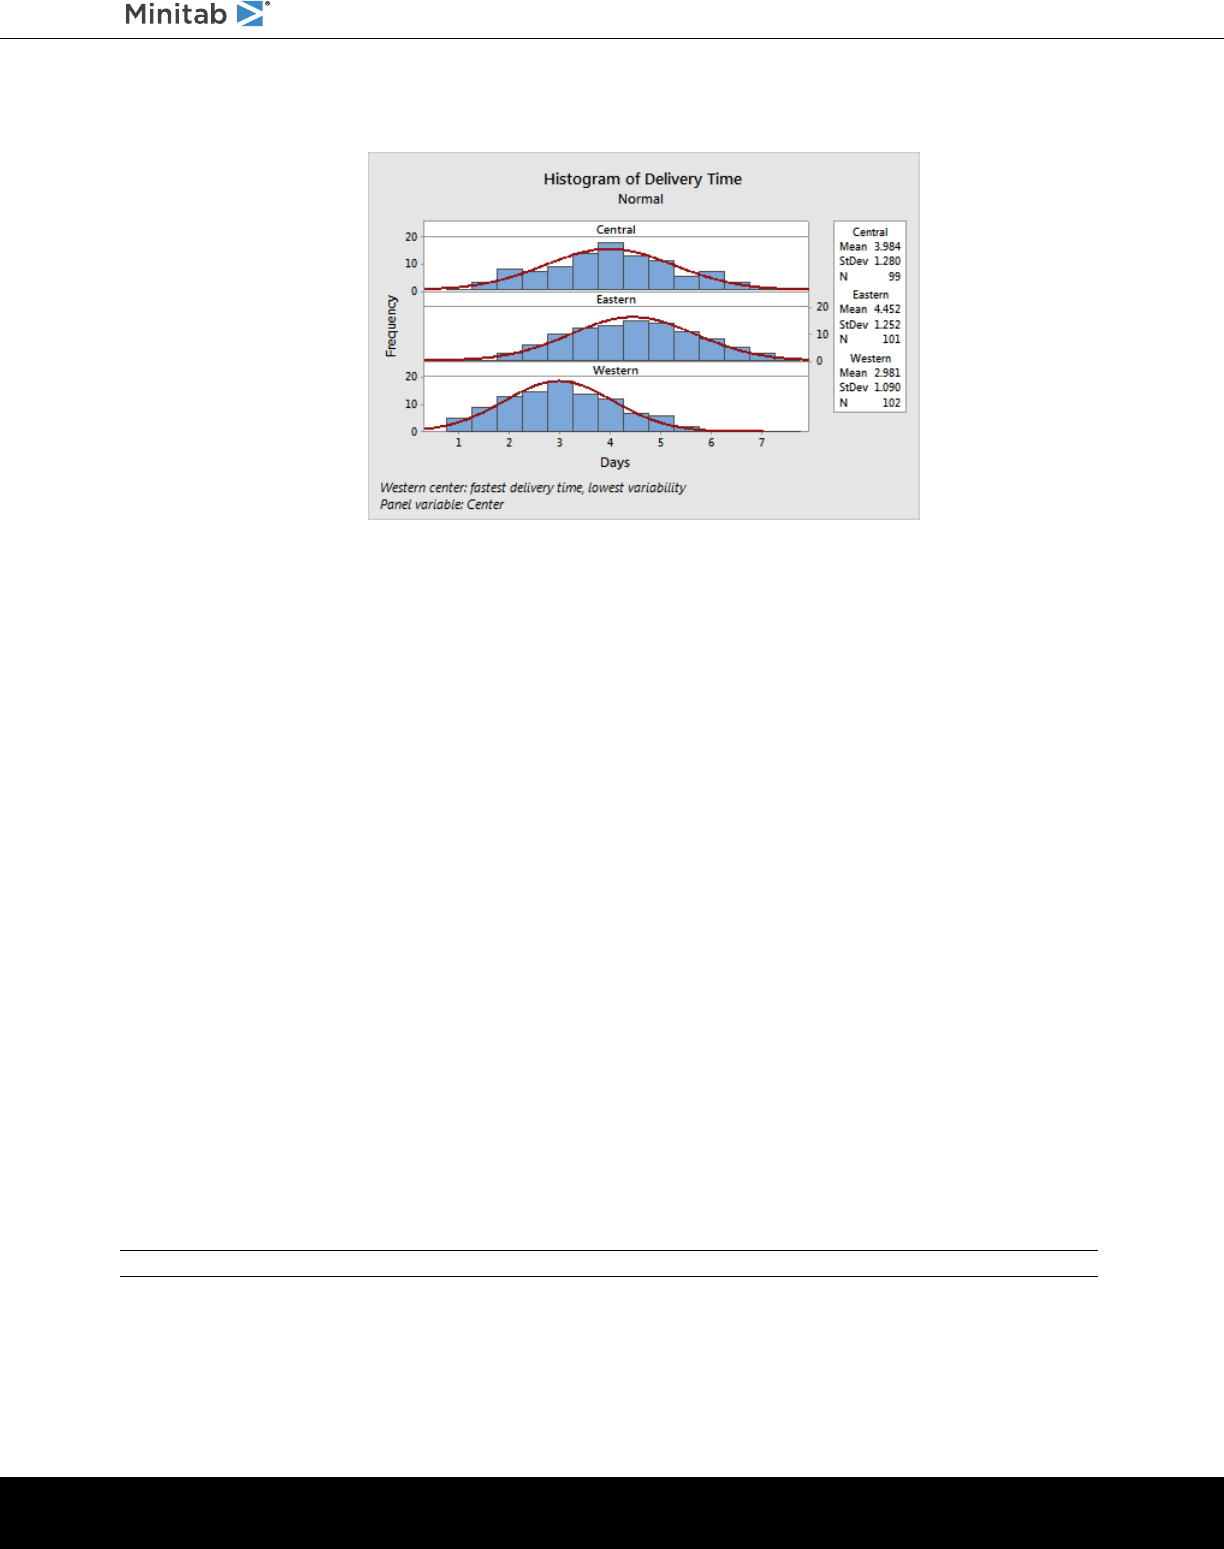
Histogram with edited title and new footnote
Interpret the results
The paneled histogram now has a more descriptive title and a footnote that provides a brief interpretation of the results.
Create and interpret scatterplots
Graphs can help you identify whether relationships exist between variables, and the strength of any relationships. Knowing
the relationship between variables can help you determine which variables are important to analyze and which additional
analyses to choose.
Because each shipping center serves a region, you suspect that distance to delivery location does not greatly affect
delivery time. To verify this suspicion and to eliminate distance as a potentially important factor, you examine the relationship
between delivery time and delivery distance for each center.
Create a scatterplot with groups
To examine the relationship between two variables, you use a scatterplot. You can choose a scatterplot from the Graph
menu or you can use the Minitab Assistant.
The Assistant can be used for most basic statistical tests, graphs, quality analyses, and DOE (design of experiments). Use
the Assistant in the following situations:
•
You need assistance to choose the correct tool for an analysis.
•
You want dialog boxes that have less technical terminology and that are easier to complete.
•
You want Minitab to check the analysis assumptions for you.
•
You want output that is more graphical and explains in detail how to interpret your results.
Note: When you use the web app, click Open in Desktop App to complete the following steps.
1. Choose Assistant > Graphical Analysis.
2. Under Graph relationships between variables, click Scatterplot (groups).
3. In Y column, enter Days.
minitab.com 13
Getting Started with Minitab Statistical Software
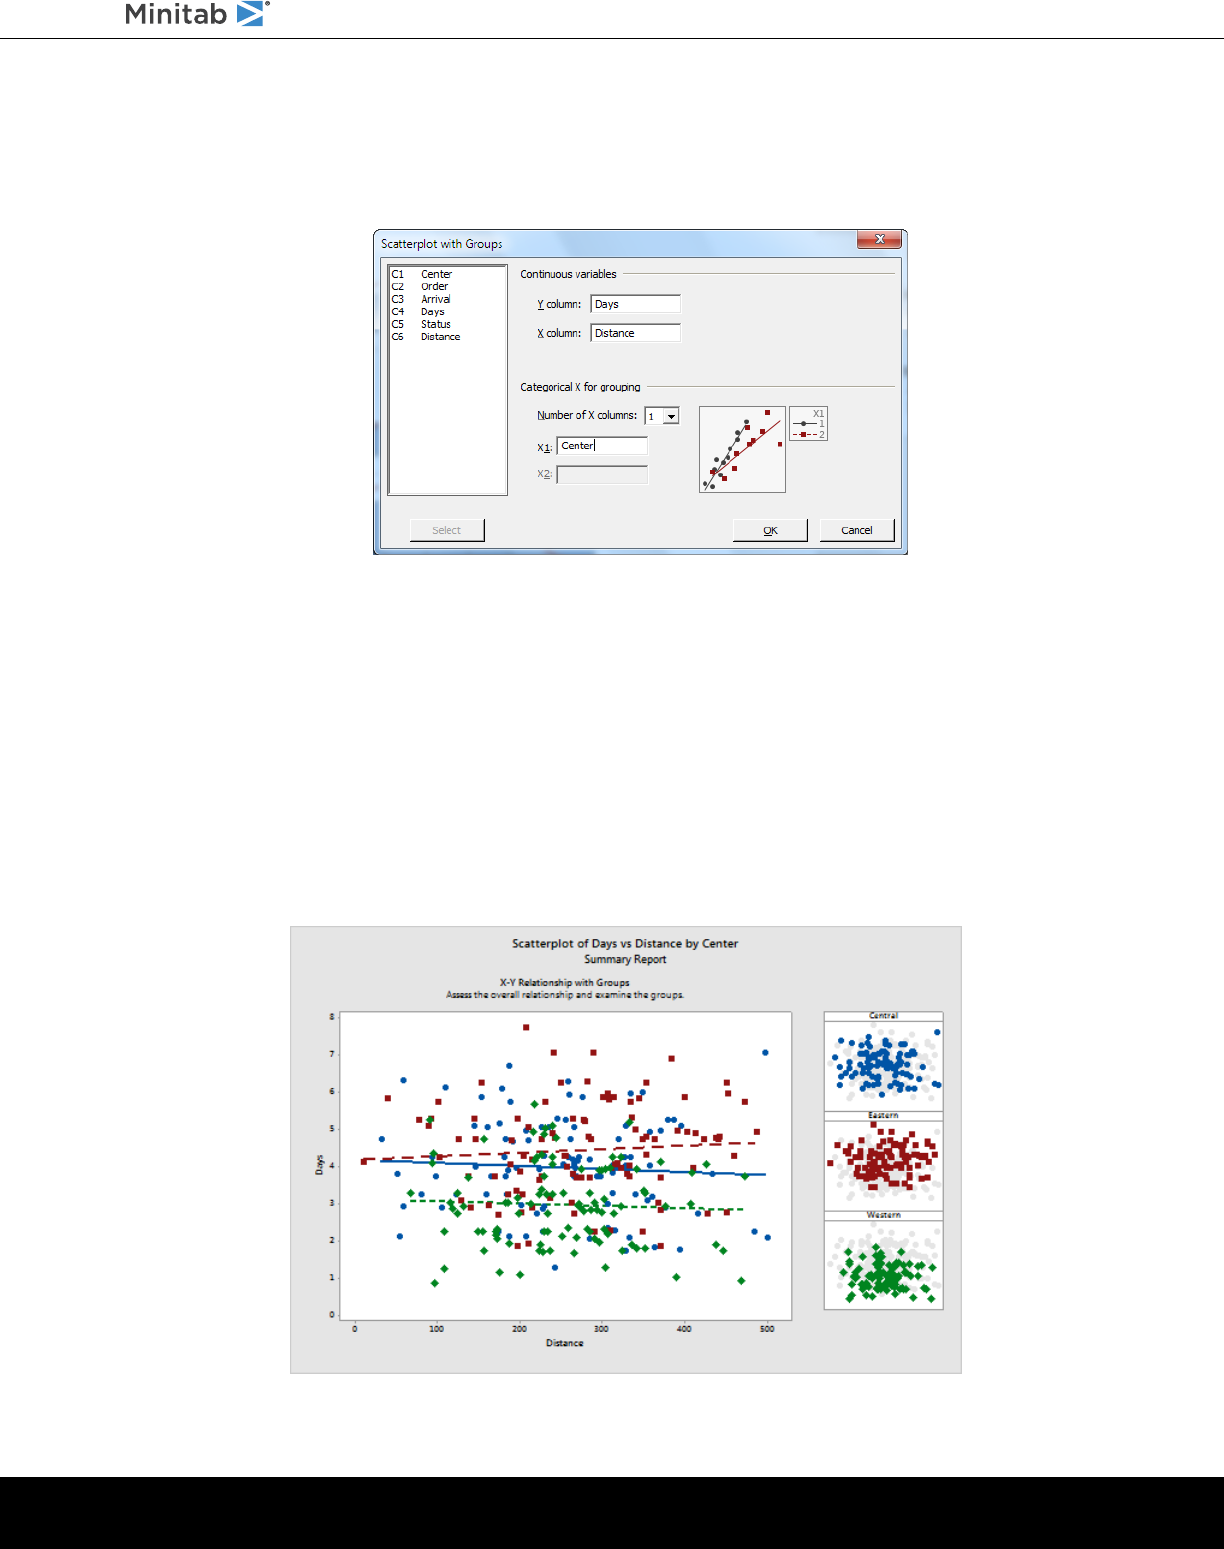
4. In X column, enter Distance.
5. In Number of X columns, choose 1.
6. In X1, enter Center.
7. Click OK.
Interpret the results
The Assistant provides standard reports to guide you through your analyses and help you interpret the results with
confidence.
Summary report
The summary report contains scatterplots of days versus distance by shipping center overlaid on the same graph. This
report also provides smaller scatterplots for each shipping center.
minitab.com 14
Getting Started with Minitab Statistical Software
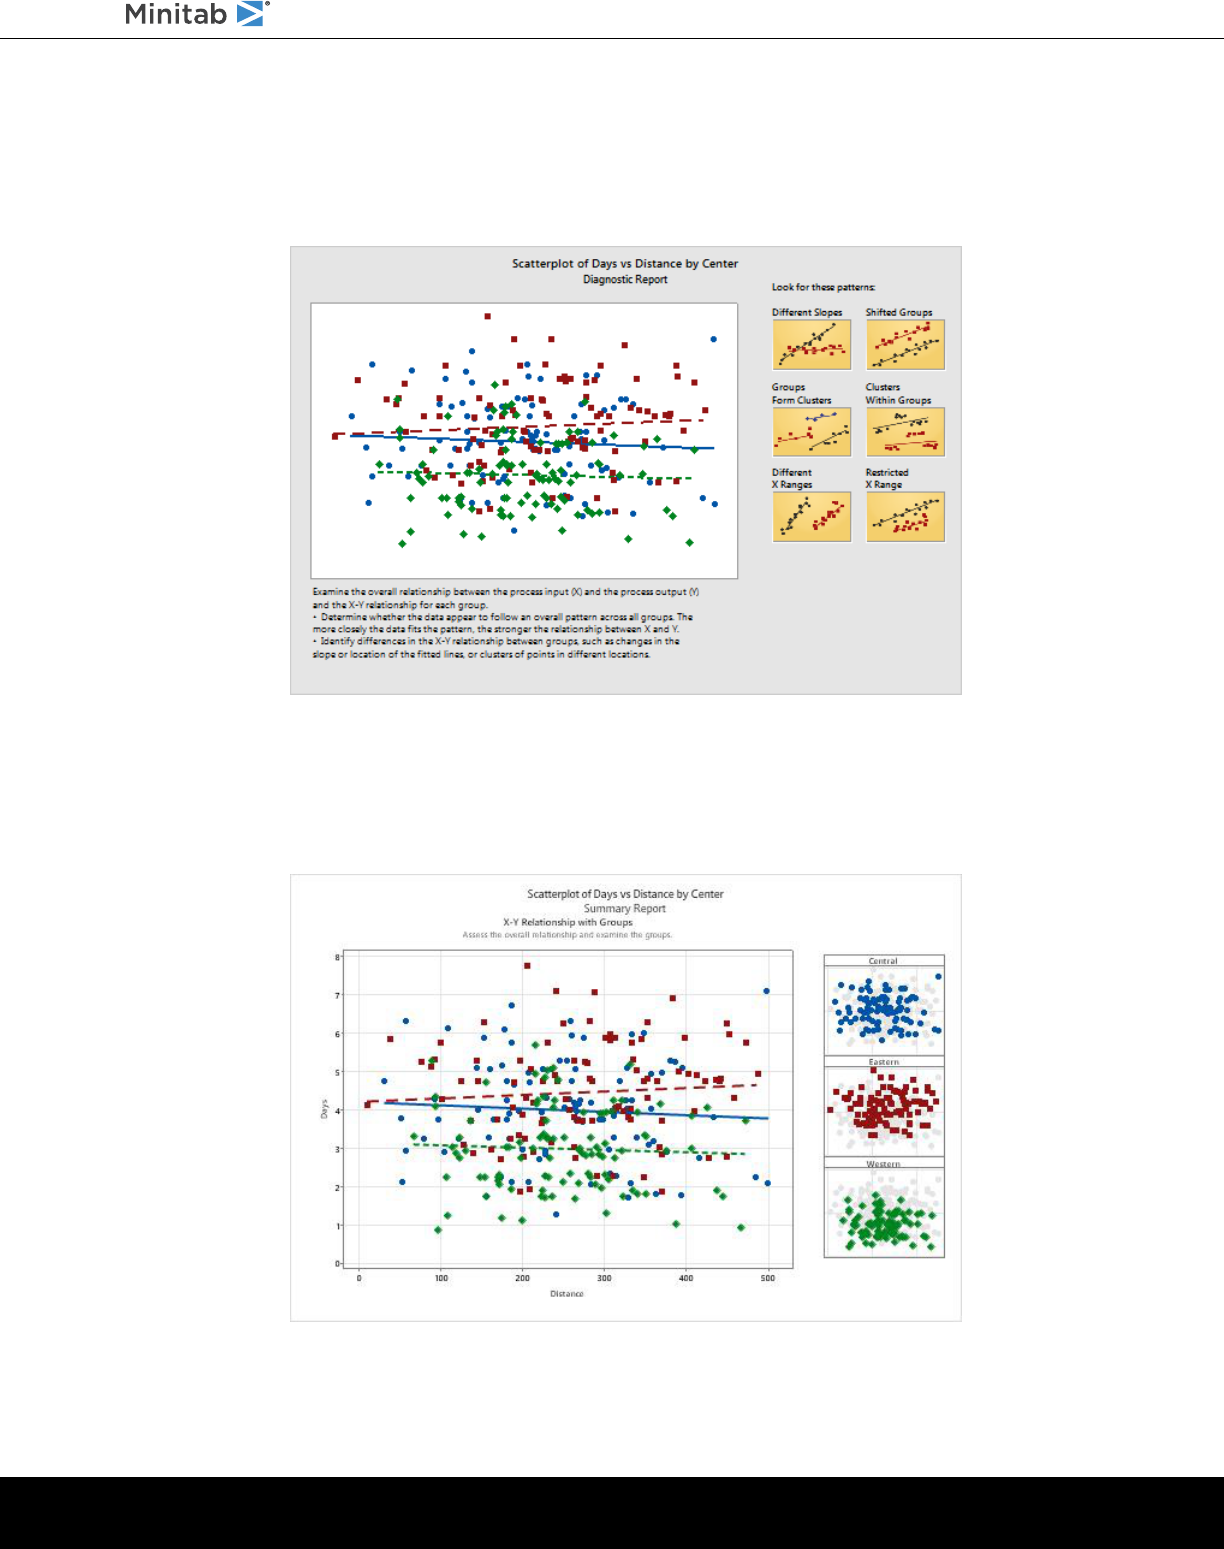
Diagnostic report
The diagnostic report provides guidance on possible patterns in your data. The points on the scatterplot show no apparent
relationship between days and distance. The fitted regression line for each center is relatively flat, which indicates that
the proximity of a delivery location to a shipping center does not affect the delivery time.
Descriptive statistics report
The descriptive statistics report contains descriptive statistics for each shipping center.
minitab.com 15
Getting Started with Minitab Statistical Software
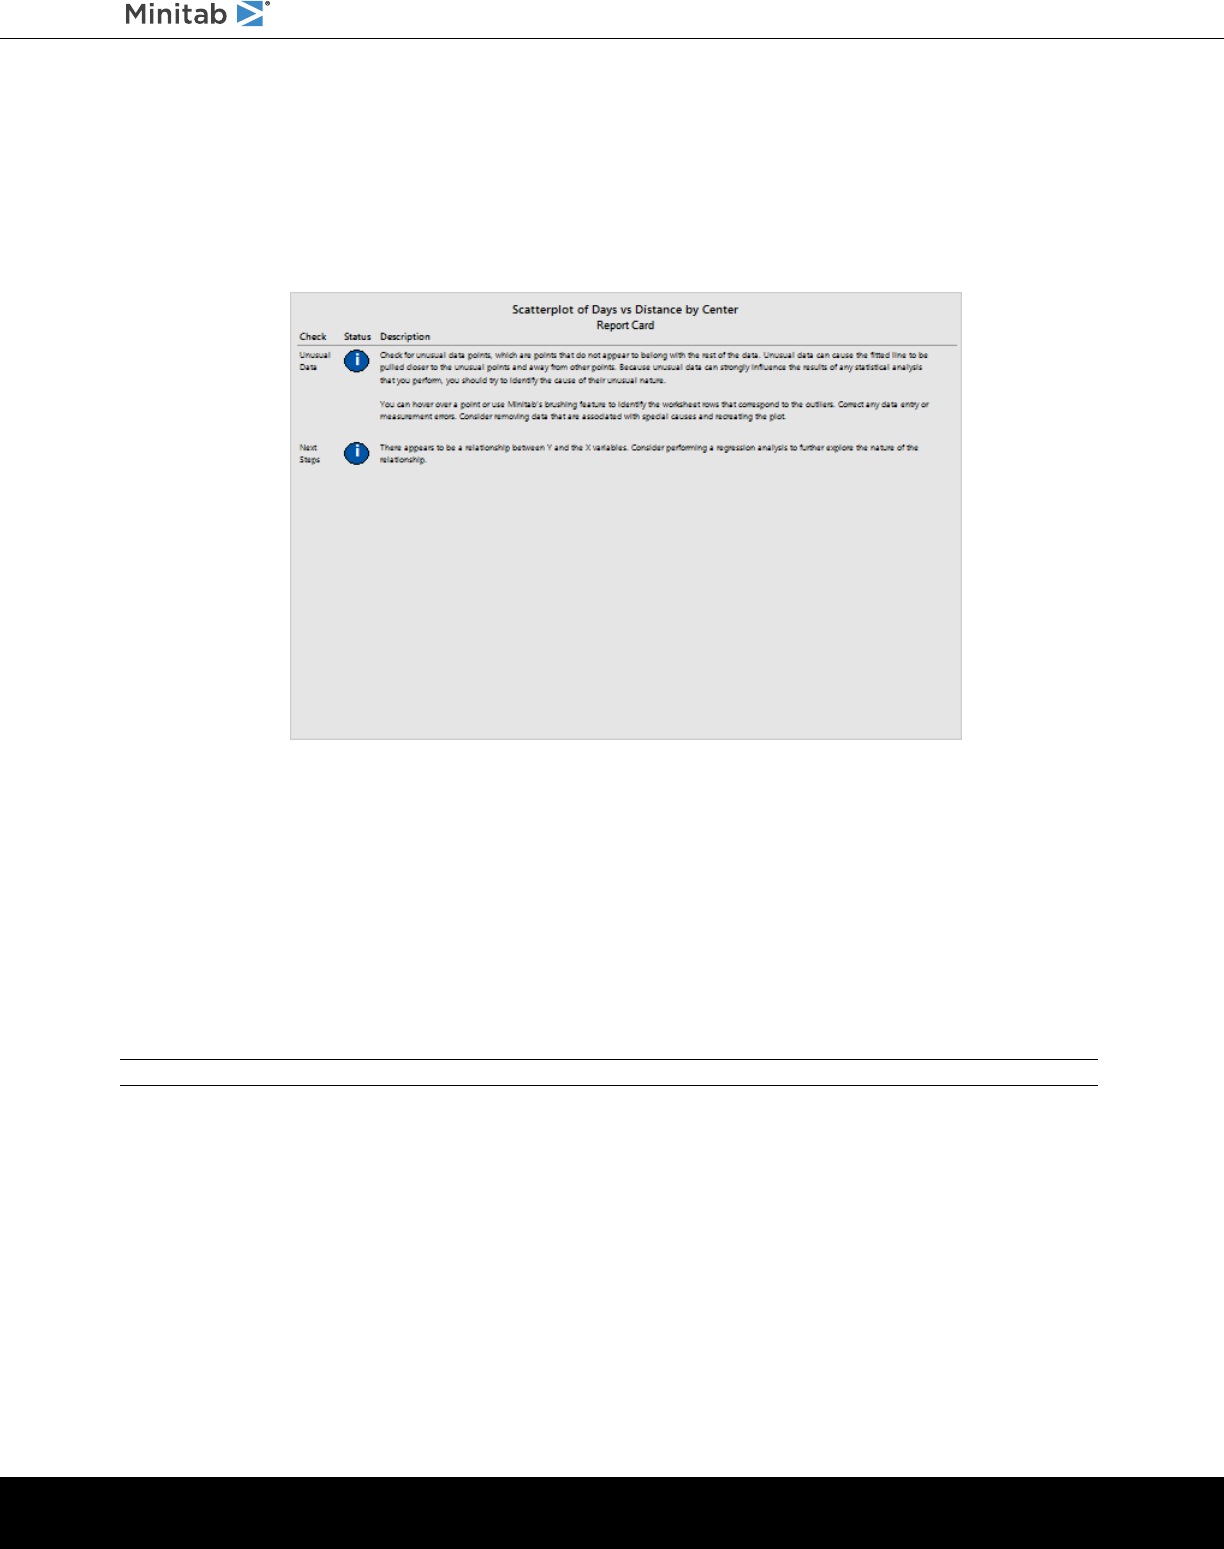
Report card
The report card provides information on how to check for unusual data. The report card also indicates that there appears
to be a relationship between the Y variable and the X variables. The Y variable is Days and the X variables are Distance
and Center. Recall that the scatterplot indicated that there does not appear to be a relationship between days and
distance. However, there may be a relationship between days and shipping center, which you will explore further in the
next chapter, Analyzing Data on page 21.
Arrange multiple graphs on one layout
Use Minitab’s graph layout tool to arrange multiple graphs on one layout. You can add annotations to the layout and edit
the individual graphs within the layout.
To show your supervisor the preliminary results of the graphical analysis of the shipping data, arrange the summary report
and the paneled histogram on one layout.
Create a graph layout
Note: When you use the web app, click Open in Desktop App to complete the following steps.
minitab.com 16
Getting Started with Minitab Statistical Software

1. Right-click the summary report and choose Layout Tool.
Graph layout with the summary report
A list of all
open graphs
Buttons used
to move
graphs to and
from the
layout
The next graph
to be moved
to the layout
The summary report that contains the scatterplot is already included in the layout.
2. To arrange two graphs on one page, in Rows, enter 1.
3. Click the summary report and drag it to the right side of the layout.
4. From the list of open graphs, select Histogram of Days, then click the right arrow button to place the paneled
histogram in the left side of the layout.
5. Click Finish.
minitab.com 17
Getting Started with Minitab Statistical Software
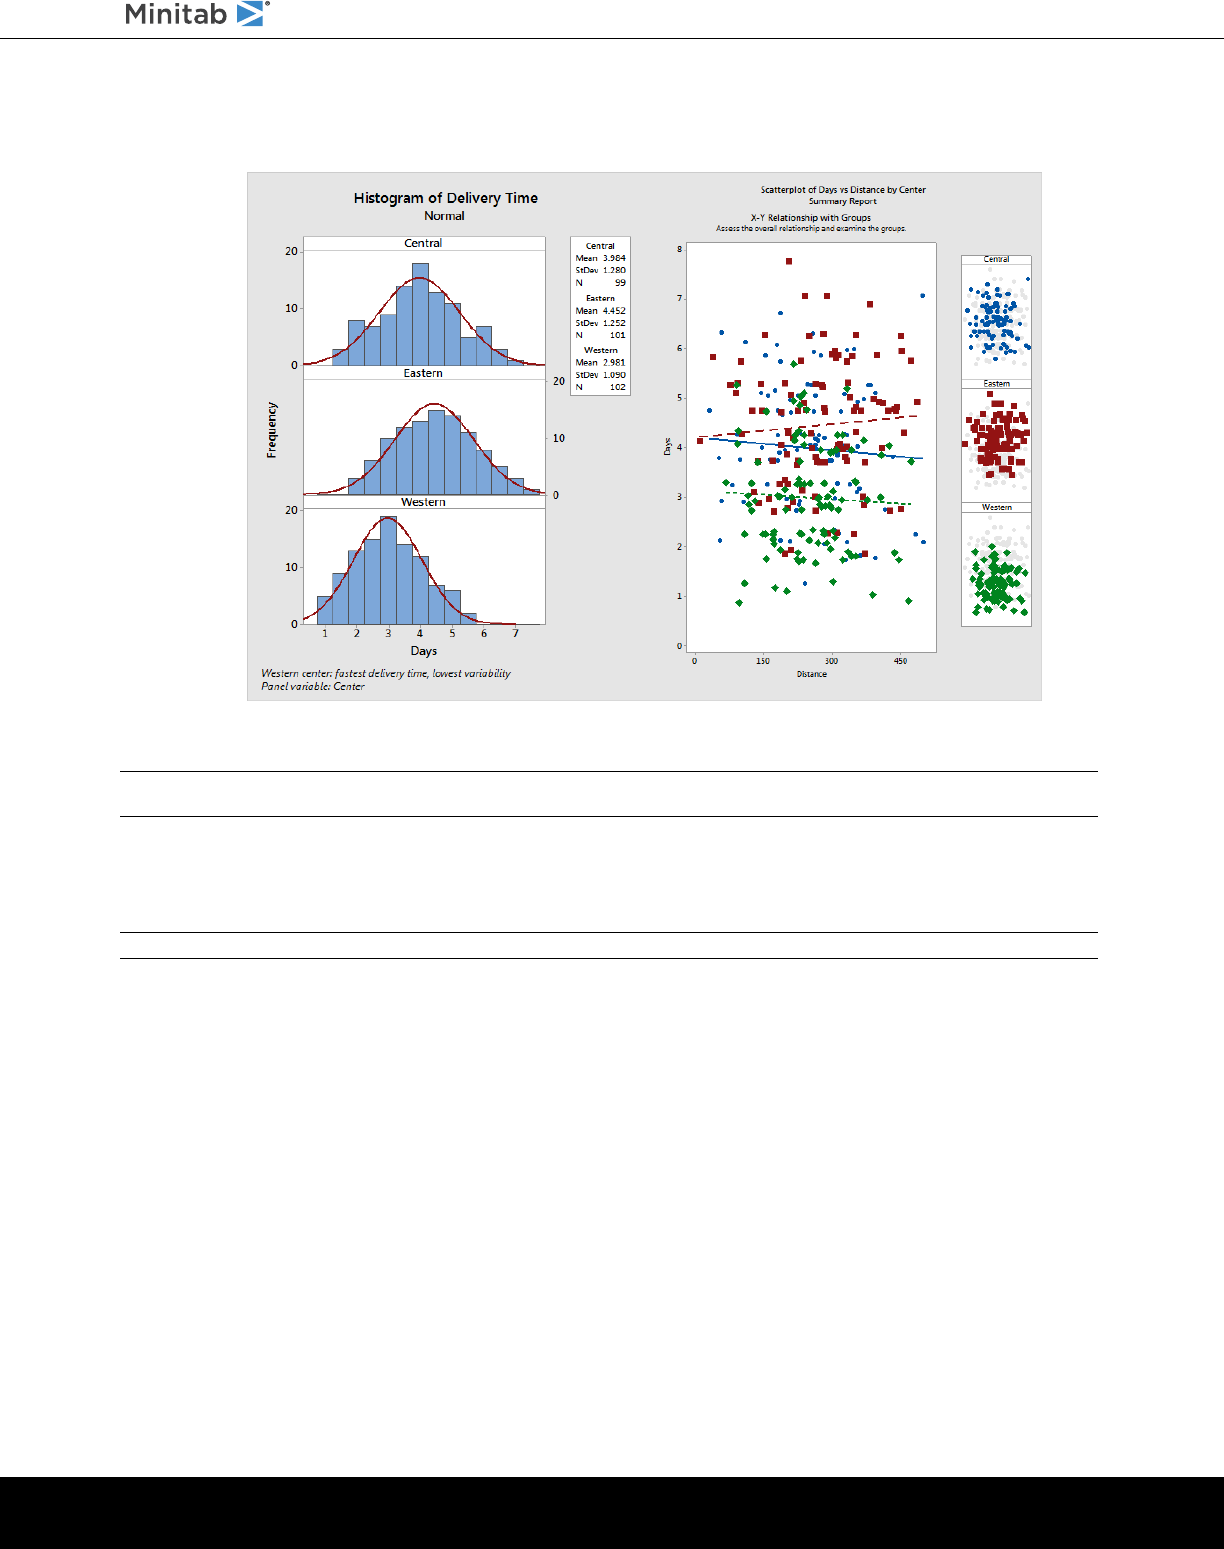
Graph layout with the paneled histogram and the scatterplot
Note: If you edit the data in the worksheet after you create a layout, Minitab cannot automatically update the graphs in the layout. You must
recreate the layout with the new graphs.
Annotate the graph layout
You want to add a descriptive title to the graph layout.
Note: When you use the web app, click Open in Desktop App to complete the following steps.
1. Double-click the graph layout.
2. To ensure that you have the entire graph layout selected, right-click the graph and choose Select Item > Graph
Region.
3. In the toolbar for the graph, click Add Item > Title.
4. In Title, enter Graphical Analysis of Shipping Data.
5. Click OK in each dialog box to show the changes in the output pane.
minitab.com 18
Getting Started with Minitab Statistical Software
Graph layout with a new title
Send graphs and tables to a report
To get the most from your data, you will likely want to communicate your results to other people. Additionally, you might
want to provide your results with explanations and other figures to help people make the best decisions. To share your
insights with others, you can send tables and graphs directly to a Minitab report.
Note: When you use the web app, click Open in Desktop App to complete the following steps.
You can send all the graphs and tables from a particular analysis or only the graphs and tables that you specify. In both
cases, Minitab adds the output to either a new report or to the bottom of an existing report.
Send all graphs and tables to a report
To send all the graphs and tables from an analysis, right-click the analysis in the Navigator and choose Send to
Report.
Send individual tables and graphs to a report
To send individual tables and graphs from an analysis, right-click the table or graph in the output pane and choose
Send to Report.
Note: You can also send the output or report to a different application, such as Microsoft
®
Word, Microsoft
®
PowerPoint, Minitab Engage
®
,
or Minitab Workspace
®
.
Save a Minitab project
Minitab data are saved in worksheets. You can also save Minitab projects. When you save a project, the file includes all
the information about your work, including worksheets, output, history of your session, and dialog box settings.
minitab.com 19
Getting Started with Minitab Statistical Software

1. If you have not already saved your project, choose File > Save Project.
2. Browse to where you want to save your project.
3. Name your project MyGraphs.
4. Click Save.
In the next chapter
The graphical output indicates that the three shipping centers have different delivery times for book orders. In the next
chapter, you display descriptive statistics and perform an ANOVA (analysis of variance) to test whether the differences
among the shipping centers are statistically significant.
minitab.com 20
Getting Started with Minitab Statistical Software
3. Analyzing Data
Overview
The field of statistics provides principles and methods for collecting, summarizing, and analyzing data, and for interpreting
the results. You use statistics to describe data and make inferences. Then, you use the inferences to improve processes
and products.
Minitab provides many statistical analyses, such as regression, ANOVA, quality tools, and time series. Built-in graphs help
you visualize your data and validate your results. In Minitab, you can also display and store statistics and diagnostic
measures.
In this chapter, you assess the number of late orders and back orders, and test whether the differences in delivery times
between the three shipping centers are statistically significant.
Summarize the data
Descriptive statistics summarize and describe the prominent features of data. Use Display Descriptive Statistics to
determine how many book orders were delivered on time, how many were late, and how many were initially back ordered
for each shipping center.
Display descriptive statistics
1. Open the data set, ShippingData.MTW.
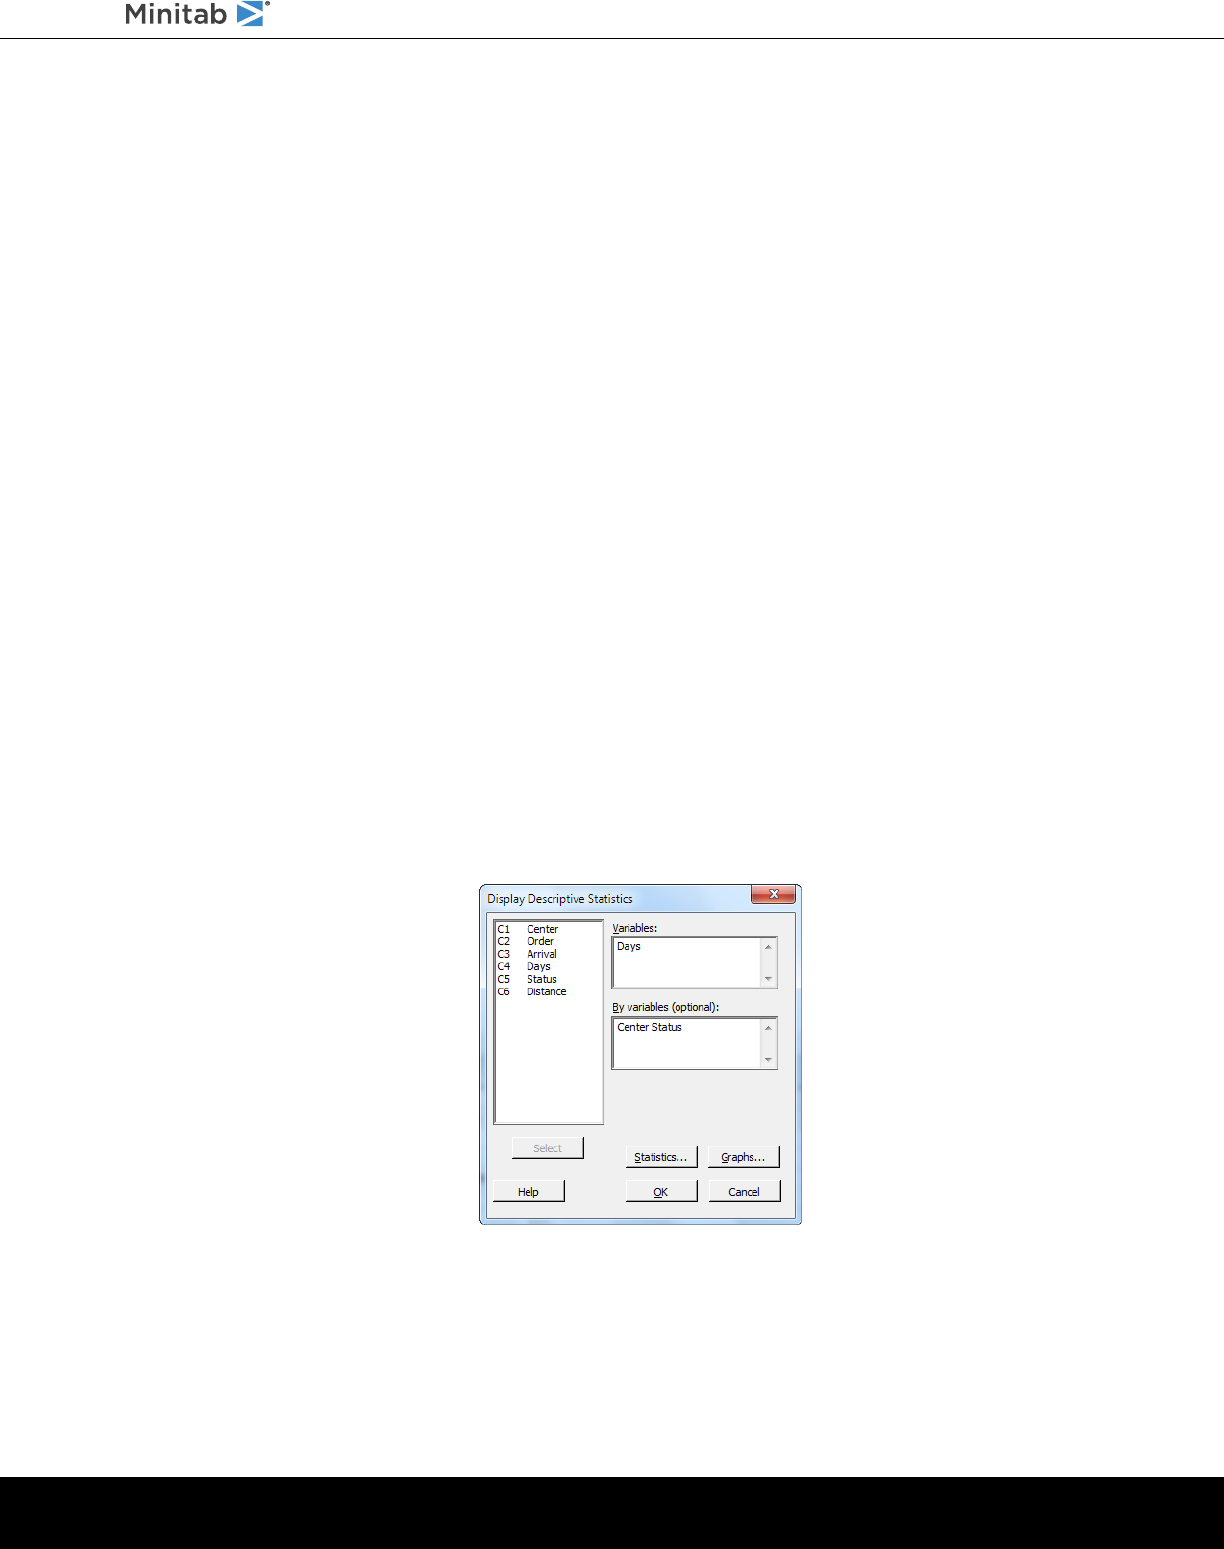
2. Choose Stat > Basic Statistics > Display Descriptive Statistics.
3. In Variables, enter Days.
4. In By variables (optional), enter Center Status.
For most Minitab commands, you need to complete only the main dialog box to execute the command. Often, you
use sub-dialog boxes to modify the analysis or to display additional output, such as graphs.
5. Click Statistics.
6. Uncheck First quartile, Median, Third quartile, N nonmissing, and N missing.
minitab.com 21
Getting Started with Minitab Statistical Software
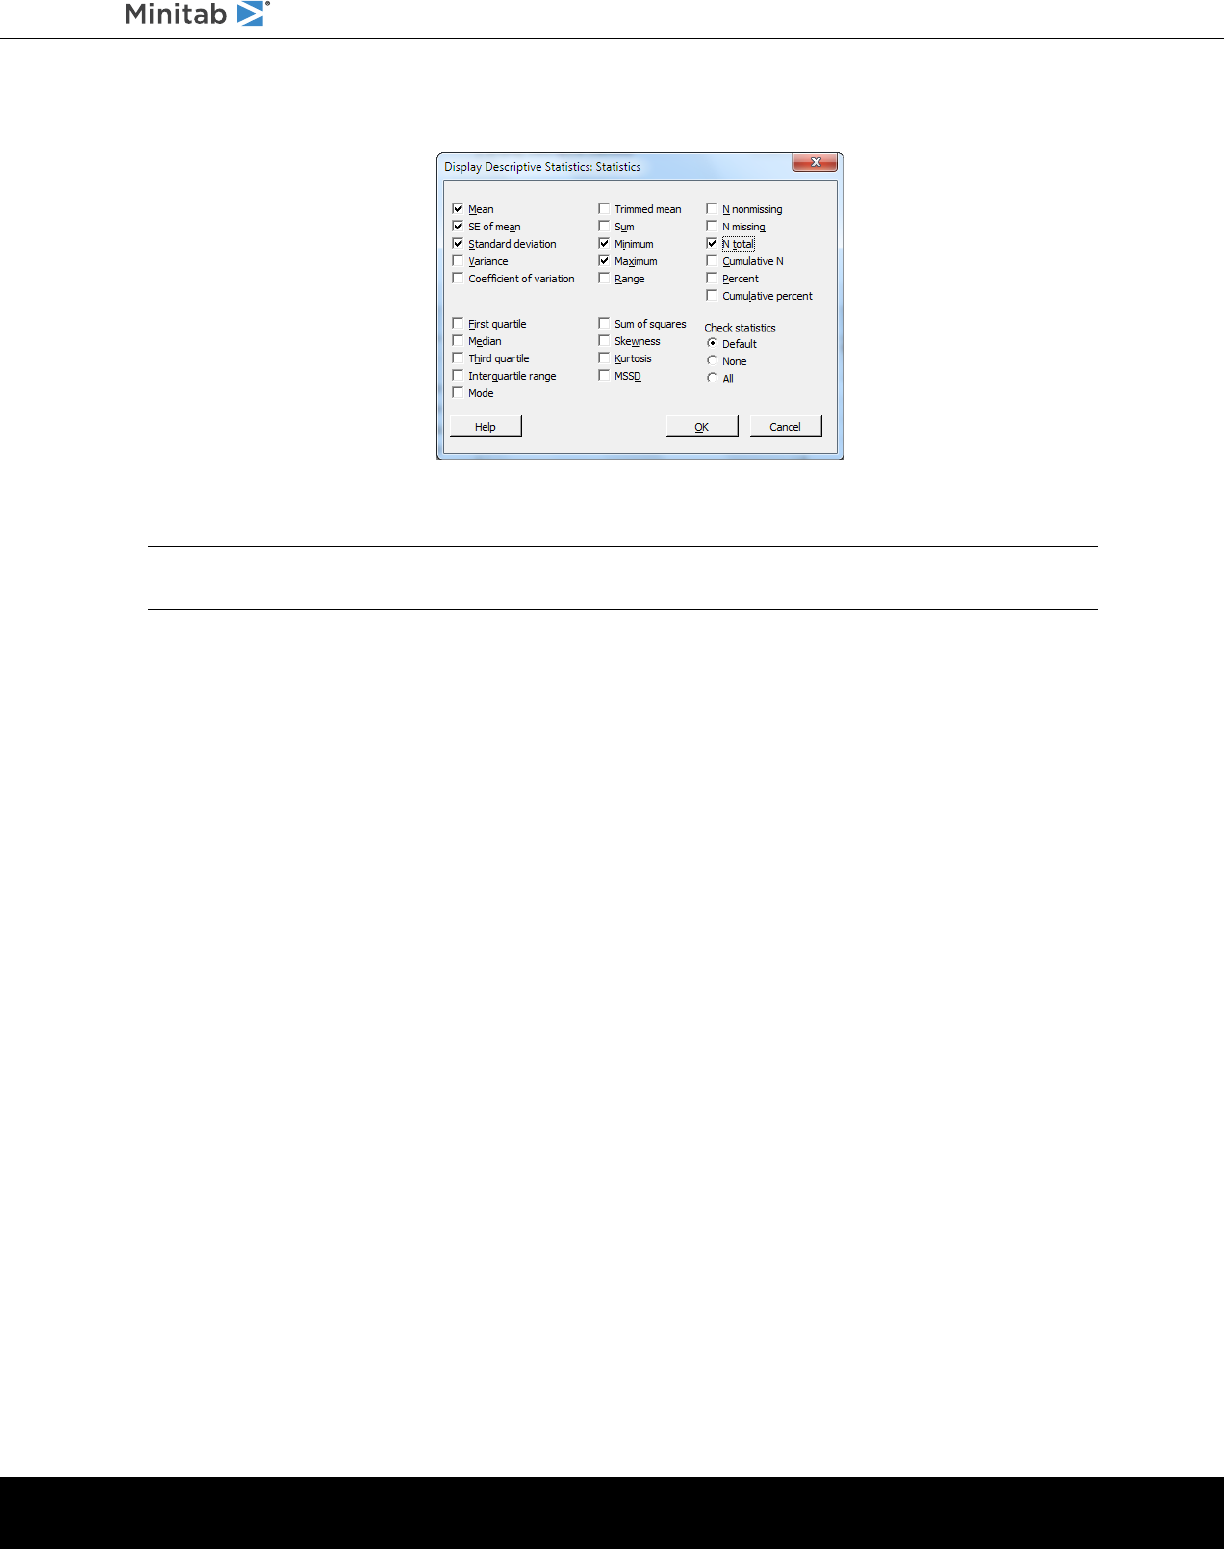
7. Check N total.
8. Click OK in each dialog box.
Note: Changes that you make in the Statistics sub-dialog box affect the current session only. You can change the default options for
future sessions. Choose File > Options. Expand Individual Commands and choose Display Descriptive Statistics. Choose the statistics
that you want to display. When you open the Statistics sub-dialog box again, it displays your new options.
Descriptive Statistics: Days
Results for Center = Central
Statistics
Total
Variable Status Count Mean SE Mean StDev Minimum Maximum
Days Back order 6 * * * * *
Late 6 6.431 0.157 0.385 6.078 7.070
On time 93 3.826 0.119 1.149 1.267 5.983
Results for Center = Eastern
Statistics
Total
Variable Status Count Mean SE Mean StDev Minimum Maximum
Days Back order 8 * * * * *
Late 9 6.678 0.180 0.541 6.254 7.748
On time 92 4.234 0.112 1.077 1.860 5.953
Results for Center = Western
Statistics
Total
Variable Status Count Mean SE Mean StDev Minimum Maximum
Days Back order 3 * * * * *
On time 102 2.981 0.108 1.090 0.871 5.681
minitab.com 22
Getting Started with Minitab Statistical Software

Note: You can send any output to locally-installed versions of Microsoft
®
Word, Microsoft
®
PowerPoint, Minitab Engage
®
, and Minitab
Workspace
®
. To send an individual graph or table, right-click the piece of output and choose the program where you want to send the output.
To send the contents of an entire output tab, right-click the output title above the line at the top of the pane.
Interpret the results
The output pane displays each center’s results separately. Within each center, you can see the number of back orders,
late orders, and on-time orders in the Total Count column:
•
The Eastern shipping center has the most back orders (8) and late orders (9).
•
The Central shipping center has the next most back orders (6) and late orders (6).
•
The Western shipping center has the fewest back orders (3) and no late orders.
The output also includes the mean, standard error of the mean, standard deviation, minimum, and maximum of delivery
time in days for each center. These statistics do not exist for back orders.
Compare two or more means
One of the most common methods used in statistical analysis is hypothesis testing. Minitab offers many hypothesis tests,
including t-tests and ANOVA (analysis of variance). Usually, when you perform a hypothesis test, you assume an initial
claim to be true, and then test this claim using sample data.
Hypothesis tests include two hypotheses (claims), the null hypothesis (H
0
) and the alternative hypothesis (H
1
). The null
hypothesis is the initial claim and is often specified based on previous research or common knowledge. The alternative
hypothesis is what you believe might be true.
Given the graphical analysis in the previous chapter and the descriptive analysis above, you suspect that the difference
in the average number of delivery days across shipping centers is statistically significant. To verify this, you perform a
one-way ANOVA, which tests the equality of two or more means. You also perform a Tukey’s multiple comparison test
to see which shipping center means are different. For this one-way ANOVA, delivery days is the response, and shipping
center is the factor.
Perform an ANOVA
1. Choose Stat > ANOVA > One-Way.
2. Choose Response data are in one column for all factor levels.
minitab.com 23
Getting Started with Minitab Statistical Software
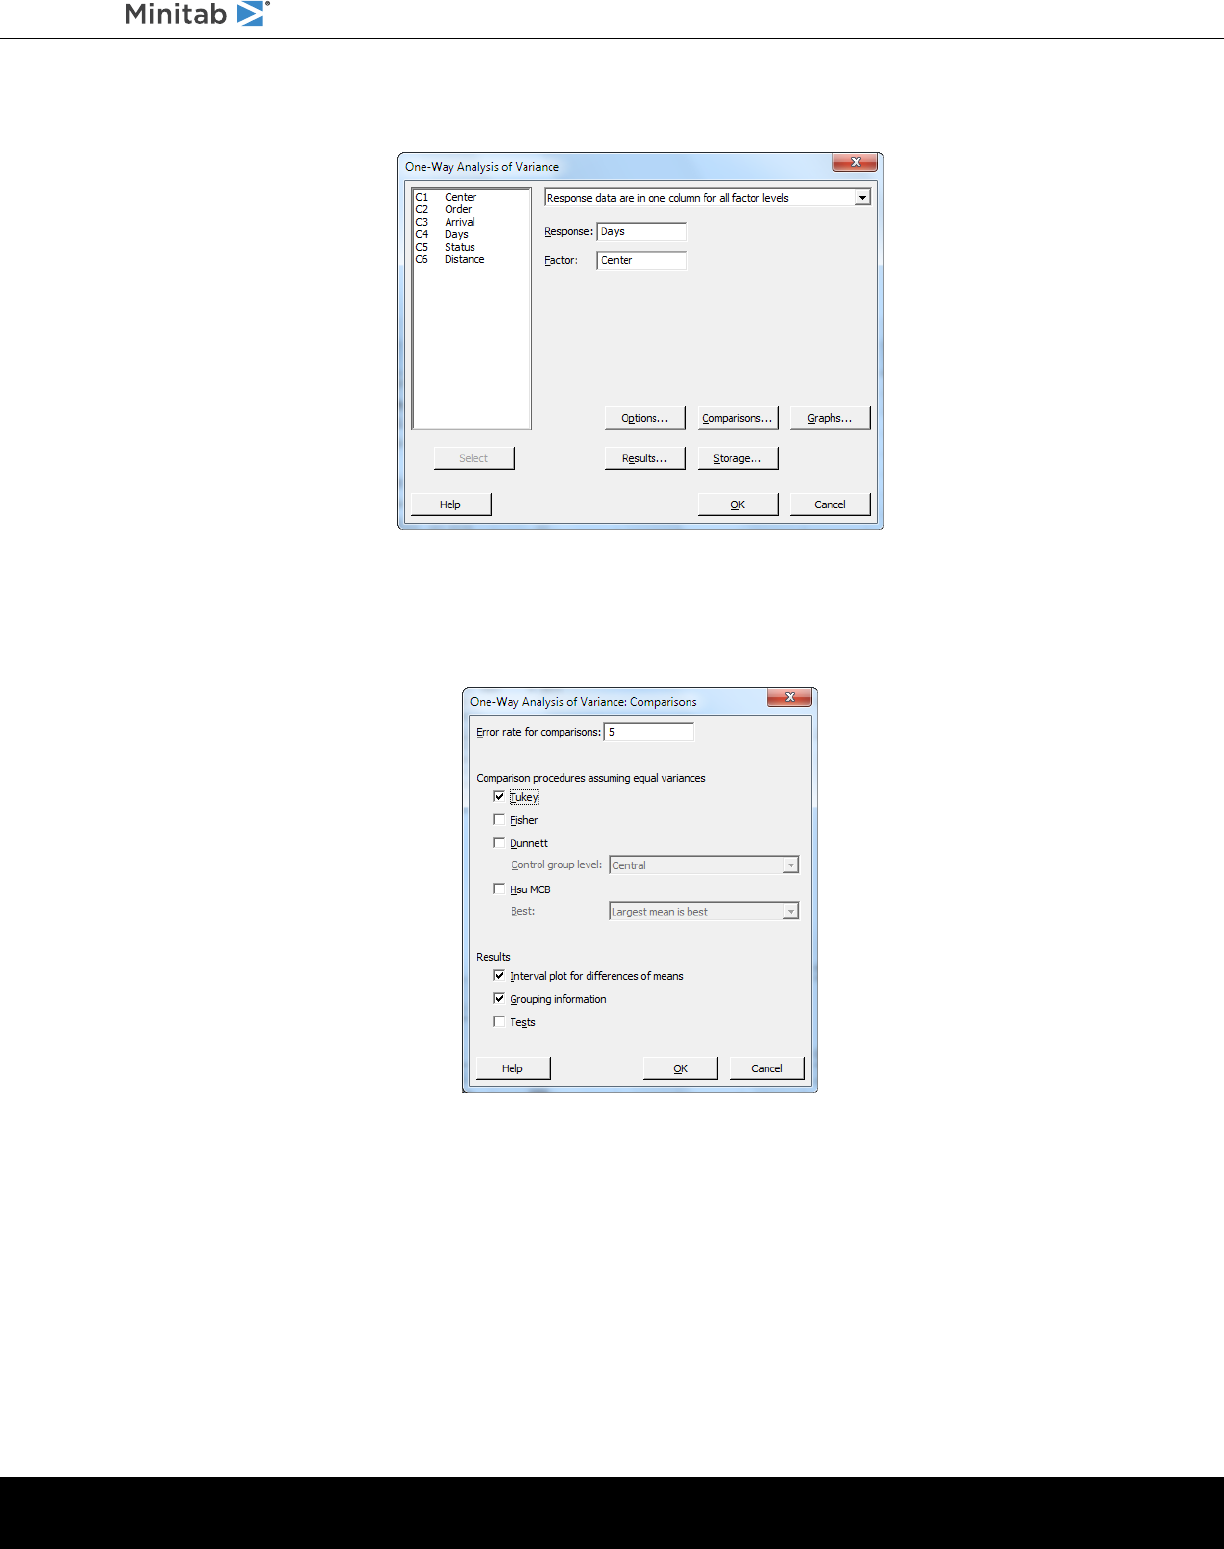
3. In Response, enter Days. In Factor, enter Center.
4. Click Comparisons.
5. Under Comparison procedures assuming equal variances, check Tukey.
6. Click OK.
7. Click Graphs.
For many statistical commands, Minitab includes graphs that help you interpret the results and assess the validity of
statistical assumptions. These graphs are called built-in graphs.
8. Under Data plots, check Interval plot, Individual value plot, and Boxplot of data.
minitab.com 24
Getting Started with Minitab Statistical Software
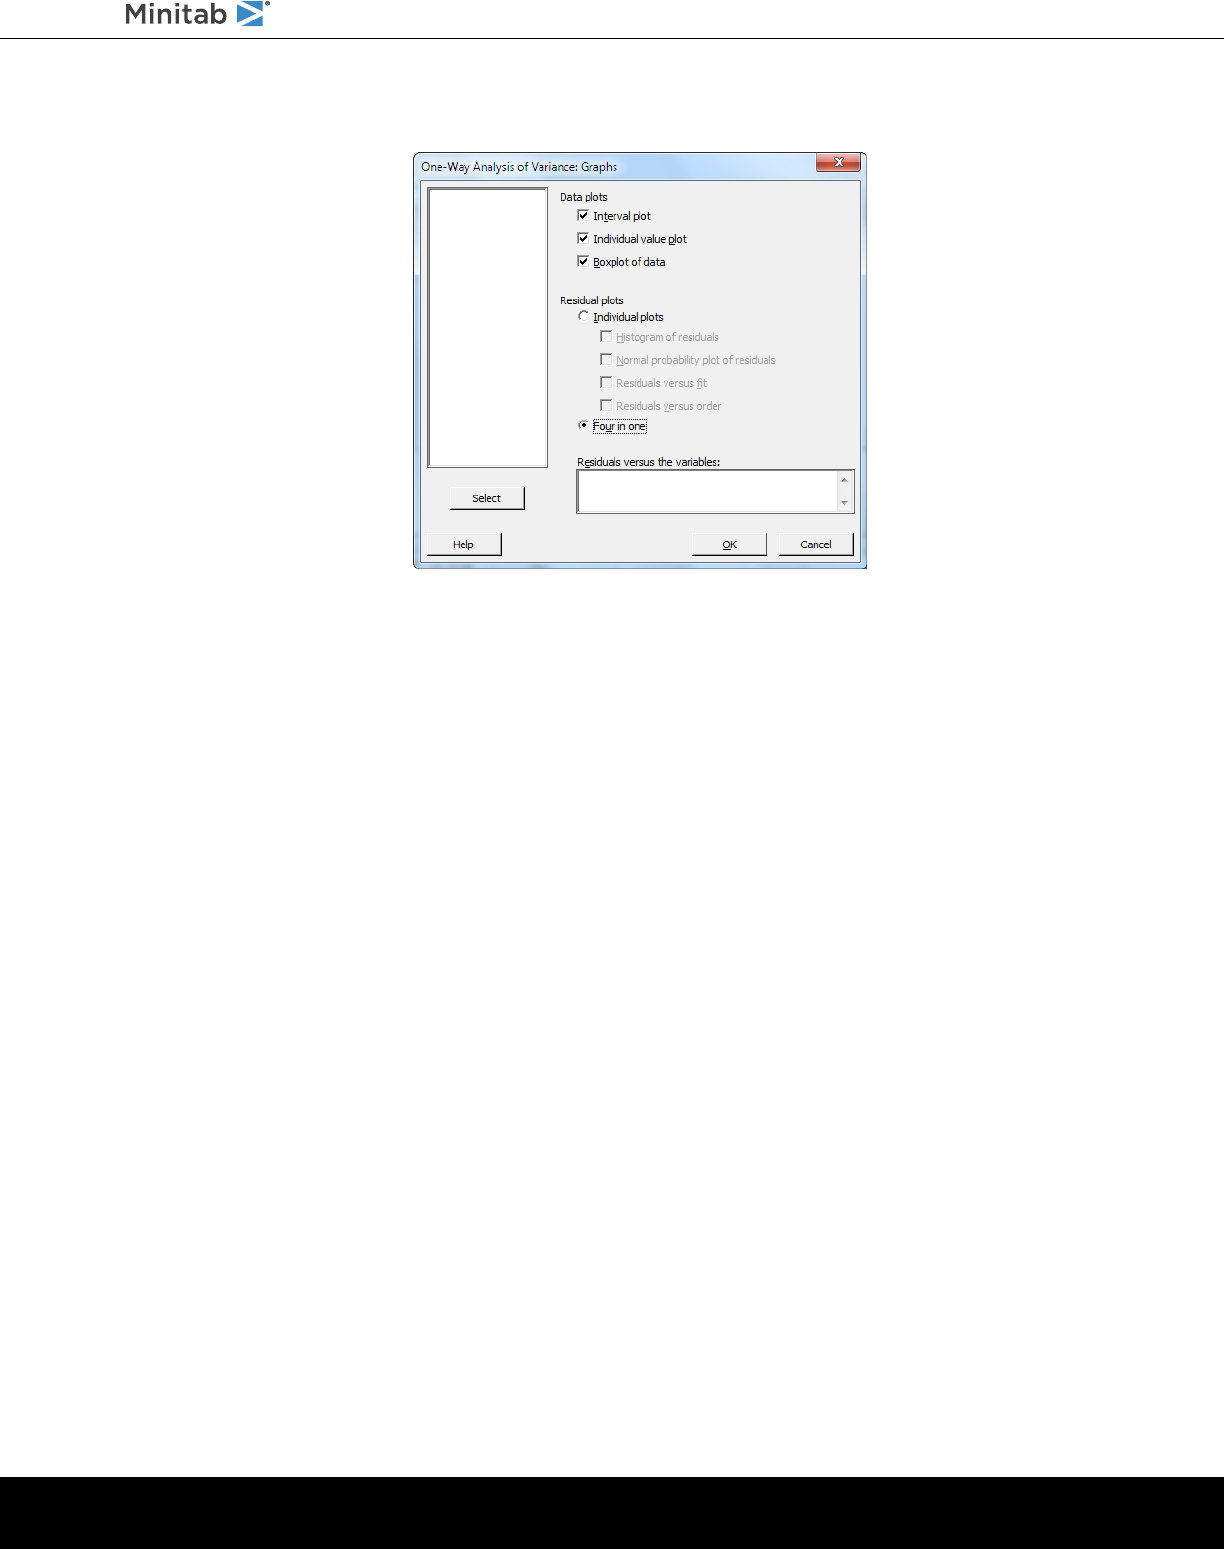
9. Under Residual plots, choose Four in one.
10. Click OK in each dialog box.
One-way ANOVA: Days versus Center
Method
Null hypothesis All means are equal
Alternative hypothesis Not all means are equal
Significance level α = 0.05
Rows unused 17
Equal variances were assumed for the analysis.
Factor Information
Factor Levels Values
Center 3 Central, Eastern, Western
Analysis of Variance
Source DF Adj SS Adj MS F-Value P-Value
Center 2 114.6 57.317 39.19 0.000
Error 299 437.3 1.462
Total 301 551.9
Model Summary
S R-sq R-sq(adj) R-sq(pred)
1.20933 20.77% 20.24% 19.17%
Means
Center N Mean StDev 95% CI
minitab.com 25
Getting Started with Minitab Statistical Software

Central 99 3.984 1.280 (3.745, 4.223)
Eastern 101 4.452 1.252 (4.215, 4.689)
Western 102 2.981 1.090 (2.746, 3.217)
Pooled StDev = 1.20933
Tukey Pairwise Comparisons
Grouping Information Using the Tukey Method and 95% Confidence
Center N Mean Grouping
Eastern 101 4.452 A
Central 99 3.984 B
Western 102 2.981 C
Means that do not share a letter are significantly different.
Tukey Simultaneous 95% CIs
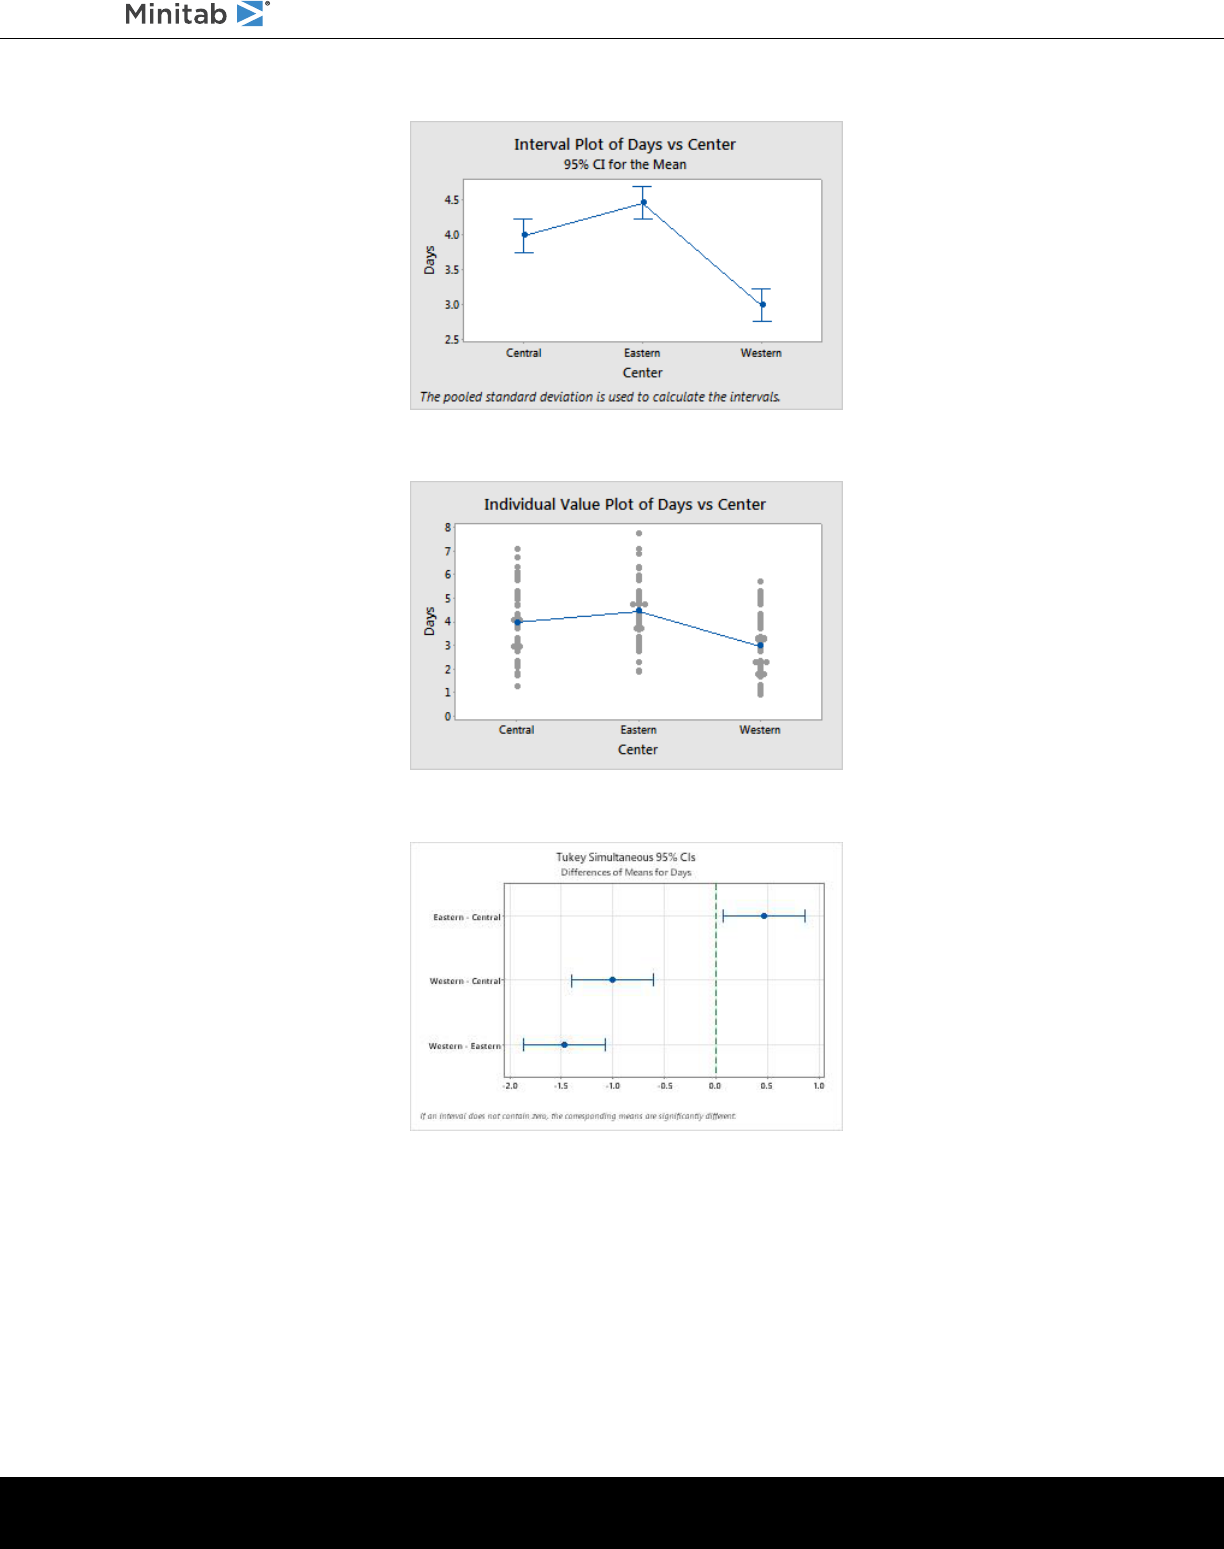
Interval Plot of Days vs Center
Individual Value Plot of Days vs Center
Boxplot of Days
Residual Plots for Days
Interpret the output
The decision-making process for a hypothesis test is based on the p-value, which indicates the probability of falsely
rejecting the null hypothesis when it is really true.
•
If the p-value is less than or equal to a predetermined significance level (denoted by α or alpha), then you reject the
null hypothesis and claim support for the alternative hypothesis.
•
If the p-value is greater than α, then you fail to reject the null hypothesis and cannot claim support for the alternative
hypothesis.
With an α of 0.05, the p-value (0.000) in the Analysis of Variance table provides enough evidence to conclude that the
average delivery times for at least two of the shipping centers are significantly different.
The results of the Tukey's test are included in the grouping information table, which highlights the significant and
non-significant comparisons. Because each shipping center is in a different group, all shipping centers have average
delivery times that are significantly different from each other.
Interpret the ANOVA graphs
Minitab produces a collection of graphs to help you interpret your results. Typically, you examine the residual plots first.
Then, you examine the interval plot, individual value plot, and boxplot together to assess the equality of the means. Finally,
you examine the Tukey 95% confidence interval plot to determine statistical significance.
minitab.com 26
Getting Started with Minitab Statistical Software
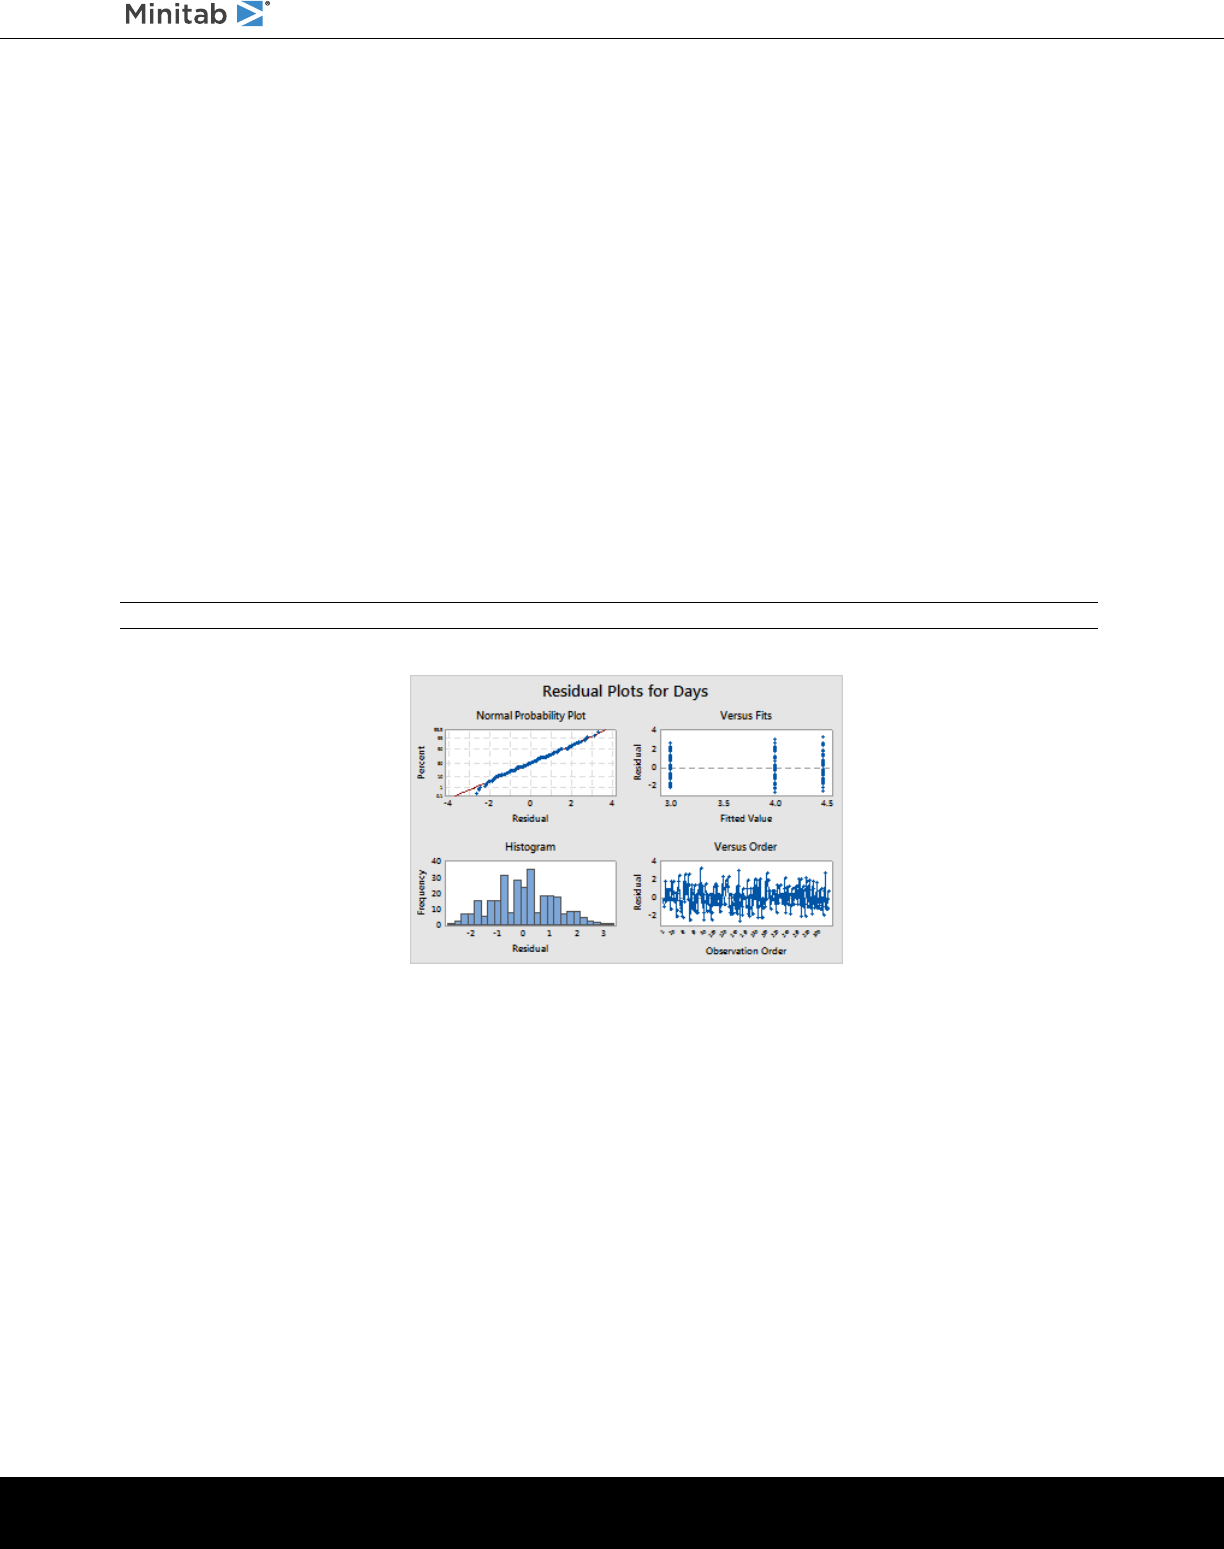
Interpret the residual plots
Use residual plots, which are available with many statistical commands, to verify statistical assumptions.
Normal Probability Plot
Use this plot to detect nonnormality. Points that approximately follow a straight line indicate that the residuals are
normally distributed.
Histogram
Use this plot to detect multiple peaks, outliers, and nonnormality. Look for a normal histogram, which is approximately
symmetric and bell-shaped.
Versus Fits
Use this plot to detect nonconstant variance, missing higher-order terms, and outliers. Look for residuals that are
scattered randomly around zero.
Versus Order
Use this plot to detect the time dependence of the residuals. Inspect the plot to ensure that the residuals display
no obvious pattern.
For the shipping data, the four-in-one residual plots indicate no violations of statistical assumptions. The one-way ANOVA
model fits the data relatively well.
Note: In Minitab, you can display each of the residual plots in a separate graph on the same tab.
Interpret the interval plot, individual value plot, and boxplot
Examine the interval plot, individual value plot, and boxplot. Each graph indicates that the delivery time varies by shipping
center, which is consistent with the histograms from the previous chapter. The boxplot for the Eastern shipping center
has an asterisk. The asterisk identifies an outlier. This outlier is an order that has an unusually long delivery time.
Examine the interval plot again. The interval plot displays 95% confidence intervals for each mean. Hold the pointer over
the points on the graph to view the means. Hold the pointer over the interval bars to view the 95% confidence intervals.
The interval plot shows that the Western shipping center has the fastest mean delivery time (2.981 days) and a confidence
interval of 2.75 to 3.22 days.
minitab.com 27
Getting Started with Minitab Statistical Software
Interpret the Tukey 95% confidence interval plot
The Tukey 95% confidence interval plot is the best graph to use to determine the likely ranges for the differences and
to assess the practical significance of those differences. The Tukey confidence intervals show the following pairwise
comparisons:
•
Eastern shipping center mean minus Central shipping center mean
•
Western shipping center mean minus Central shipping center mean
•
Western shipping center mean minus Eastern shipping center mean
minitab.com 28
Getting Started with Minitab Statistical Software
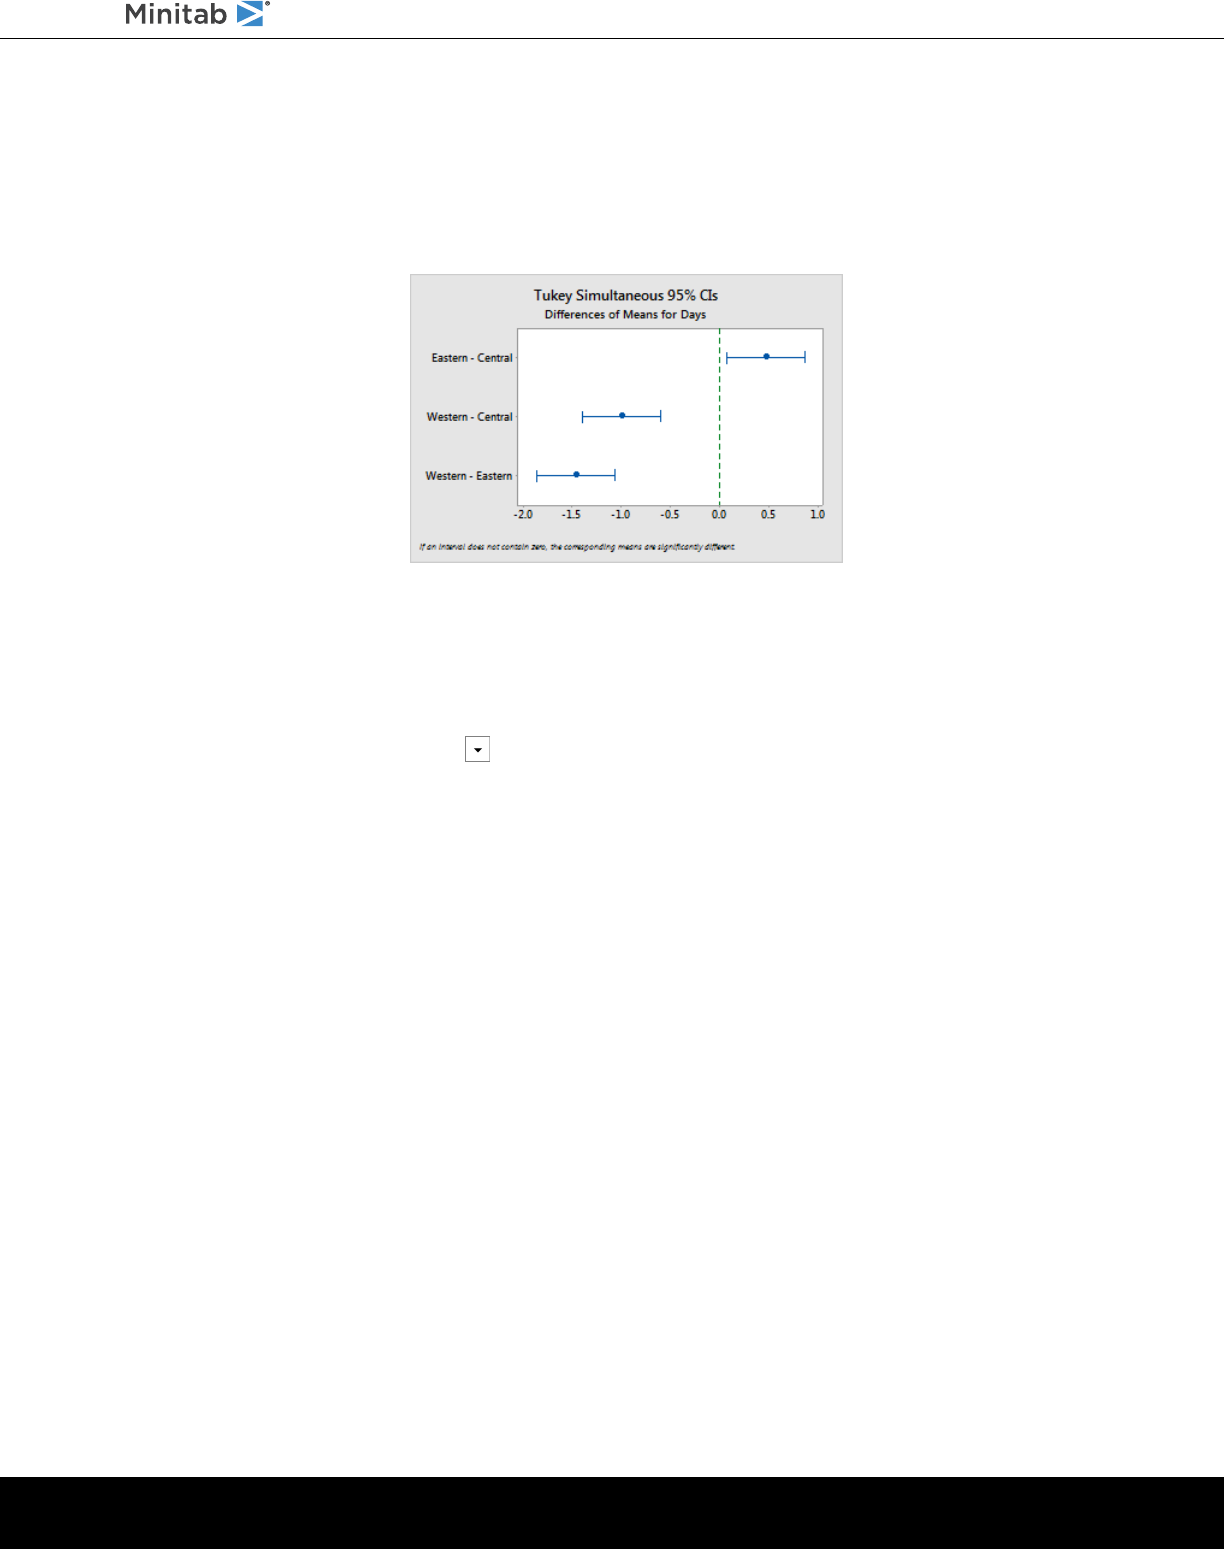
Hold the pointer over the points on the graph to view the middle, upper, and lower estimates. The interval for the Eastern
minus Central comparison is 0.068 to 0.868. That is, the mean delivery time of the Eastern shipping center minus the
mean delivery time of the Central shipping center is between 0.068 and 0.868 days. The Eastern shipping center's
deliveries take significantly longer than the Central shipping center's deliveries. You interpret the other Tukey confidence
intervals similarly. Also, notice the dashed line at zero. If an interval does not contain zero, the corresponding means are
significantly different. Therefore, all the shipping centers have significantly different average delivery times.
Get more information about interpreting the output
Suppose you want more information about how to interpret a one-way ANOVA, specifically Tukey’s multiple comparison
method. Minitab provides detailed information about the output for most statistical commands.
•
From the output pane, click the arrow and choose Help.
Save the project
Save all your work in a Minitab project.
1. If you have not already saved your project, choose File > Save Project.
2. Browse to where you want to save your project.
3. Name your project MyStats.
4. Click Save.
In the next chapter
The descriptive statistics and ANOVA results indicate that the Western shipping center has the fewest late orders and
back orders, and has the shortest delivery time. In the next chapter, you create a control chart and perform a capability
analysis to investigate whether the Western shipping center’s process is stable over time and is capable of operating
within specifications.
minitab.com 29
Getting Started with Minitab Statistical Software

4. Assessing Quality
Overview
Quality is the degree to which products or services meet the needs of customers. Common goals for quality professionals
include reducing defect rates, manufacturing products within specifications, and standardizing delivery time.
Minitab offers many methods to help you assess quality in an objective, quantitative way. These methods include control
charts, quality planning tools, measurement systems analysis (gage R&R studies), process capability, and reliability/survival
analysis. This chapter focuses on control charts and process capability.
You can customize Minitab's control charts in the following ways:
•
Update the chart after you add or change data.
•
Choose how to estimate parameters and control limits.
•
Display tests for special causes and historical stages.
•
Customize the chart, such as adding a reference line, changing the scale, and modifying titles.
You can customize control charts when you create them or later.
With Minitab's capability analysis, you can do the following:
•
Analyze process data from many different distributions, including normal, exponential, Weibull, gamma, Poisson, and
binomial.
•
Display charts to verify that the process is in control and that the data follow the chosen distribution.
The graphical and statistical analyses that you performed in the previous chapter show that the Western shipping center
has the fastest delivery time. In this chapter, you determine whether the Western shipping center’s process is in control
and is capable of operating within specifications.
Create and interpret control charts
Unusual patterns in your data indicate the presence of special-cause variation, that is, variation that is not a normal part
of the process. Use control charts to detect special-cause variation and to assess process stability over time.
Minitab control charts display process statistics. Process statistics include subgroup means, individual observations,
weighted statistics, and numbers of defects. Minitab control charts also display a center line and control limits. The center
line is the average value of the quality statistic that you choose to assess. If a process is in control, the points will vary
randomly around the center line. The control limits are calculated based on the expected random variation in the process.
The upper control limit (UCL) is 3 standard deviations above the center line. The lower control limit (LCL) is 3 standard
deviations below the center line. If a process is in control, all points on the control chart are between the upper and lower
control limits.
For all control charts, you can modify Minitab’s default chart specifications. For example, you can define the estimation
method for the process standard deviation, specify the tests for special causes, and display historical stages.
Create an Xbar-S chart
Create an Xbar-S chart to assess both the mean and variability of the process. This control chart displays an Xbar chart
and an S chart on the same graph. Use an Xbar-S chart when your subgroups contain 9 or more observations.
To determine whether the delivery process is stable over time, the manager of the Western shipping center randomly
selected 10 samples for 20 days.
1. Open the data set, Quality.MTW.
minitab.com 30
Getting Started with Minitab Statistical Software
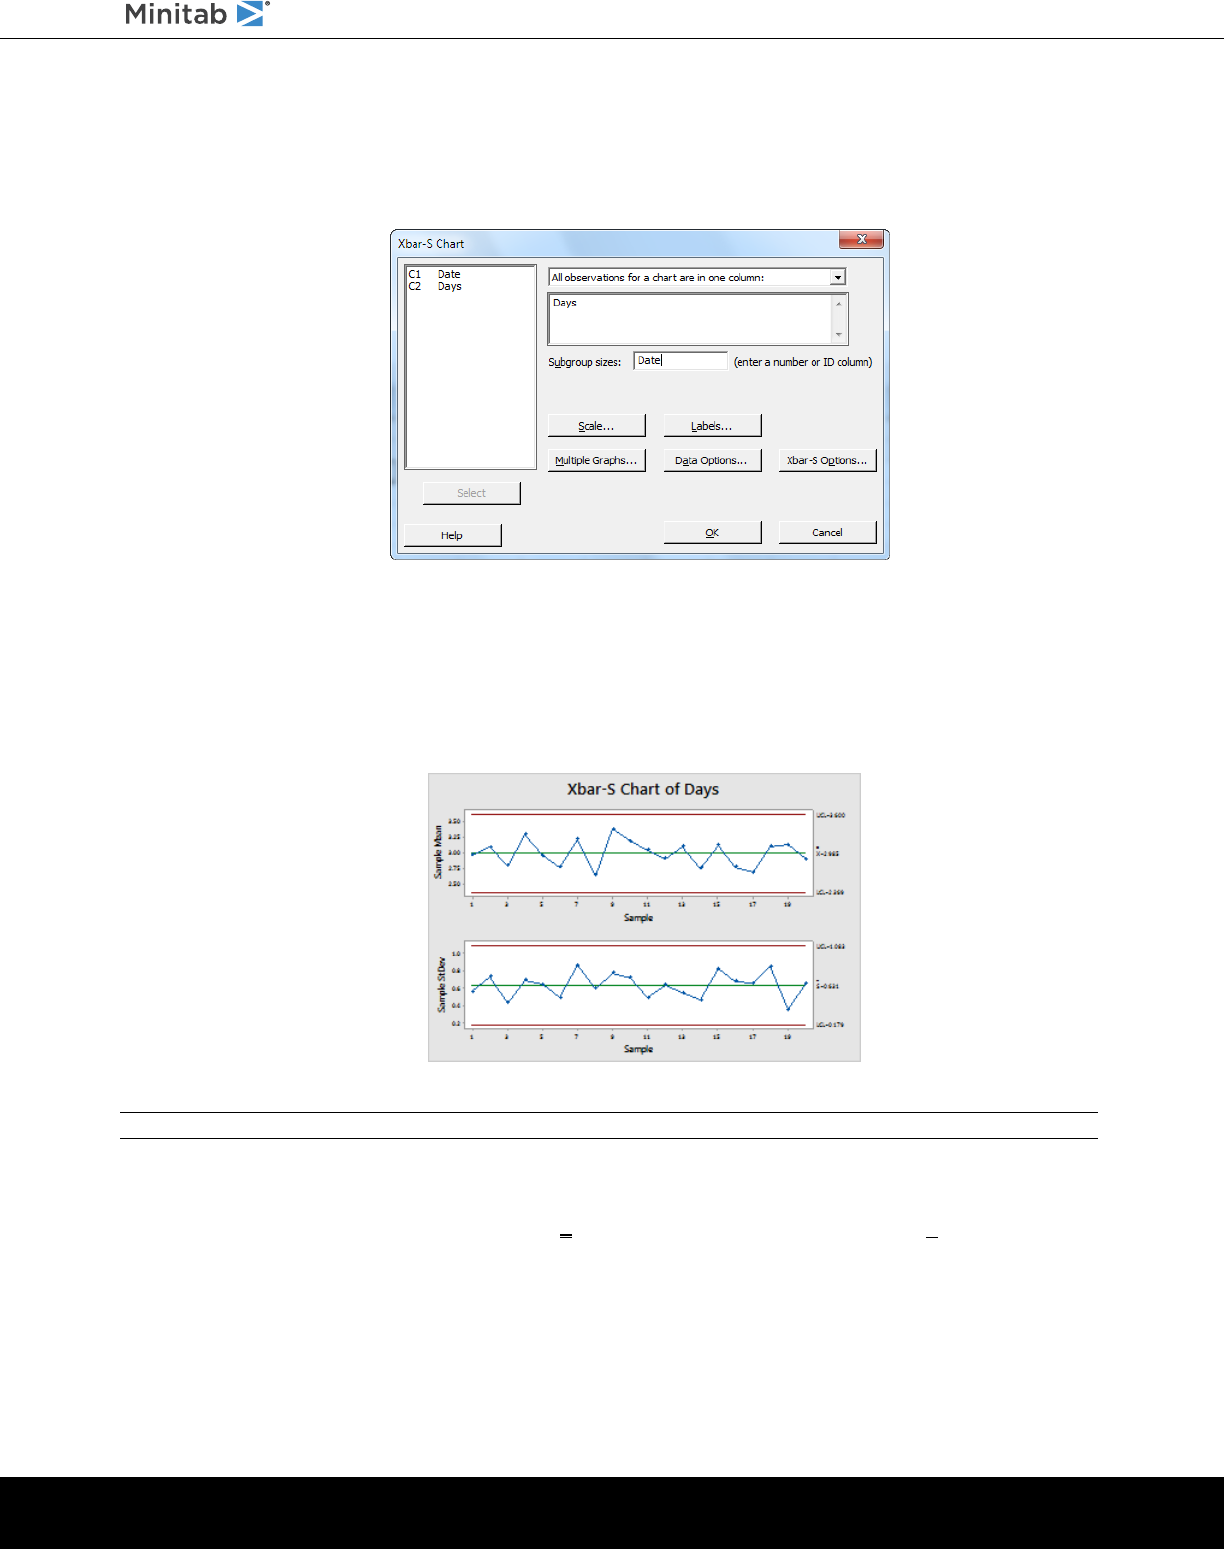
2. Choose Stat > Control Charts > Variables Charts for Subgroups > Xbar-S.
3. Choose All observations for a chart are in one column, then enter Days.
4. In Subgroup sizes, enter Date.
To create a control chart, you only need to complete the main dialog box. However, you can click any button to select
options to customize your chart.
5. Click OK.
Xbar-S chart
Tip: Hold the pointer over points on a control chart or graph to view information about the data.
Interpret the Xbar-S chart
All of the points on the control chart are within the control limits. Thus, the process mean and process standard deviation
appear to be stable or in control. The process mean (X) is 2.985. The average standard deviation (S) is 0.631.
Add stages to the control chart
You can use stages on a control chart to show how a process changes over specific periods of time. At each stage,
Minitab recalculates the center line and control limits.
minitab.com 31
Getting Started with Minitab Statistical Software
The manager of the Western shipping center made a process change on March 15. You want to determine whether the
process was stable before and after this process change.
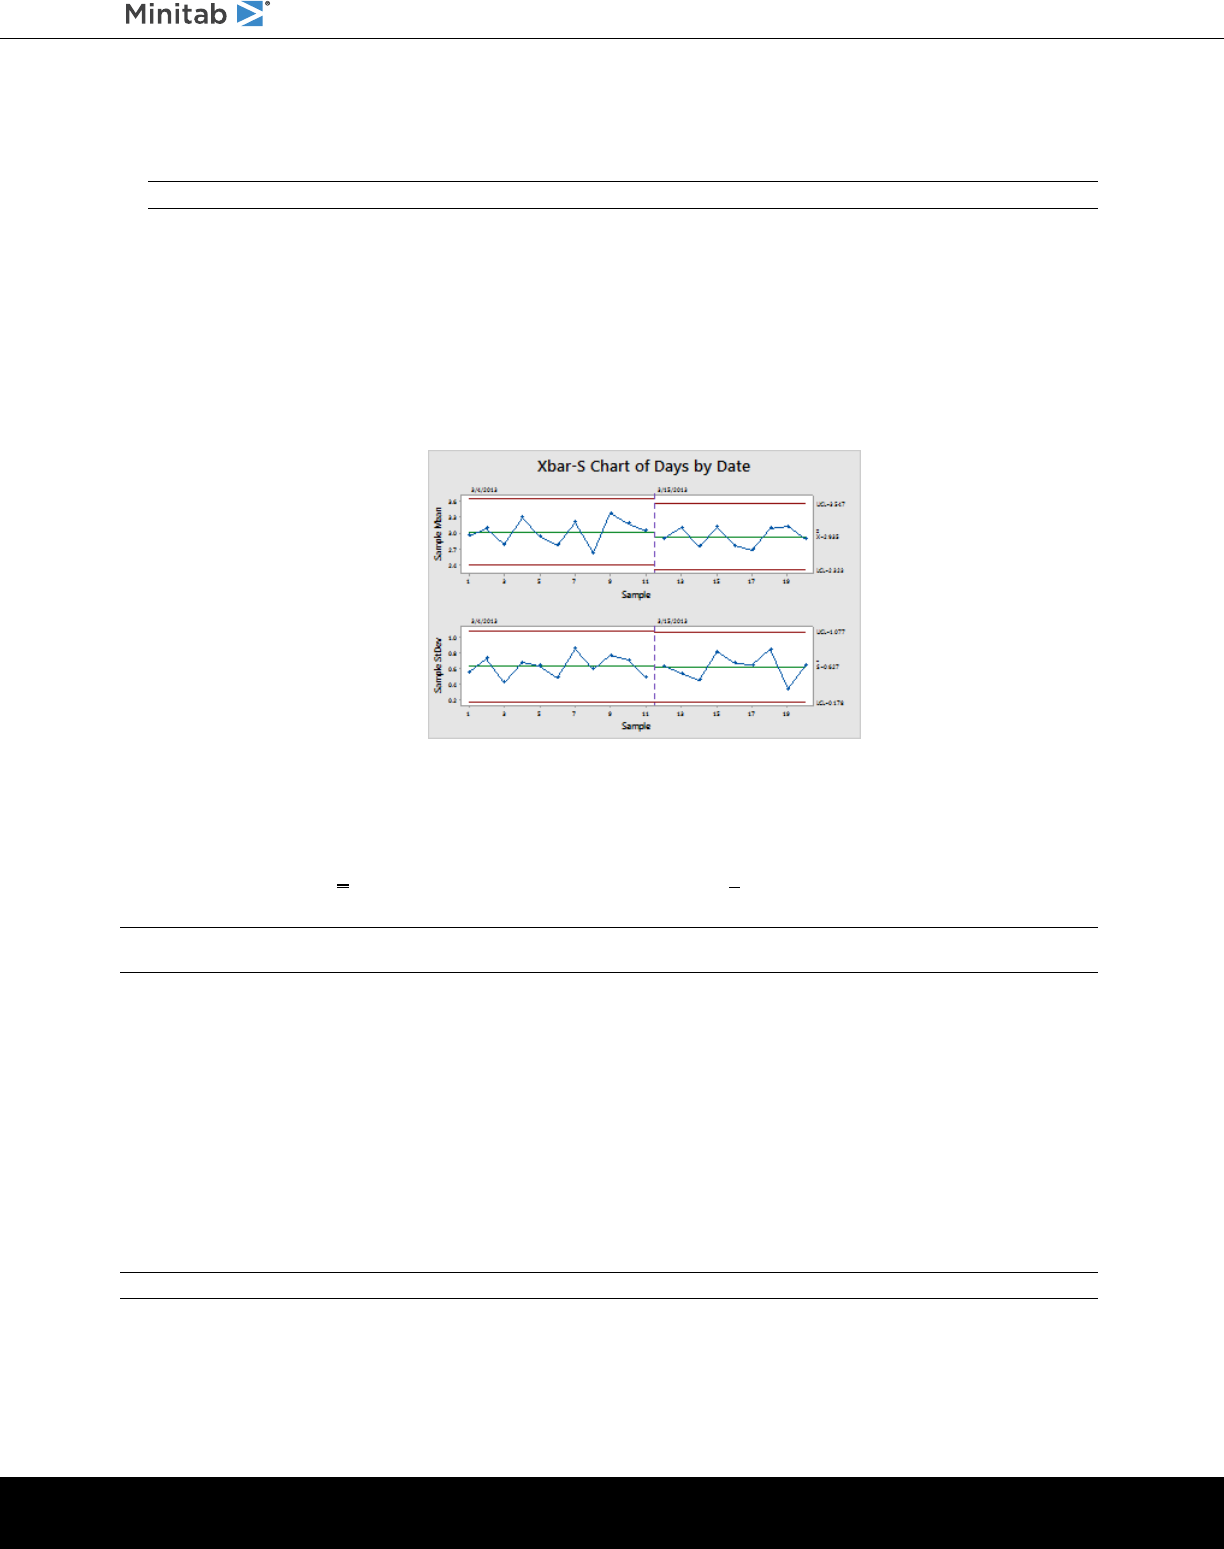
1. Press Ctrl+E to open the last dialog box, or choose Stat > Control Charts > Variables Charts for Subgroups > Xbar-S.
Tip: Minitab saves your dialog box settings with your project. To reset a dialog box, press F3.
2. Click Xbar-S Options.
3. On the Stages tab, in Define stages (historical groups) with this variable, enter Date.
4. Under When to start a new stage, select With the first occurrence of these values, and enter "3/15/2020".
5. Click OK in each dialog box to show the changes in the output pane.
Xbar-S chart with stages
Interpret the results
All of the points on the control chart are within the control limits before and after the process change. For the second
stage, the process mean (X) is 2.935 and the average standard deviation (S) is 0.627.
Note: By default, Minitab displays the control limits and center line labels for the most recent stage. To display labels for all stages, in the
Xbar-S Chart dialog box, click Xbar-S Options. On the Display tab, under Other, select Display control limit / center line labels for all stages.
Add more data and update the control chart
When your data change, you can update any control chart or graph (except stem-and-leaf plot) without re-creating the
graph.
After you create the Xbar-S chart, the manager of the Western shipping center gives you more data, which was collected
on 3/24. Add the data to the worksheet and update the control chart.
Add more data to the worksheet
You need to add date/time data to C1 and numeric data to C2.
Note: When you use the web app, click Open in Desktop App to complete the following steps.
1. Click the worksheet to make it active.
2. Click any cell in C1, and then press End to go to the bottom of the worksheet.
minitab.com 32
Getting Started with Minitab Statistical Software
3. To add the date, 3/24, to rows 201–210:
a. Enter 3/24 in row 201 in C1.
b. Select the cell that contains 3/24, and point to the Autofill handle in the lower-right corner of the cell. When the
pointer becomes a cross symbol ( + ), press Ctrl and drag the pointer to row 210 to fill the cells with the repeated
date value. When you press and hold Ctrl, a superscript cross appears above the Autofill cross symbol ( +
+
). The
superscript cross indicates that repeated values, instead of sequential values, will be added to the cells.
4. Add the following data to C2, starting in row 201:
3.60 2.40 2.80 3.21 2.40 2.75 2.79 3.40 2.58 2.50
As you enter data, press Enter to move to the next cell down.
C3C2C1-D
DaysDate
3.603/241
2.403/242
2.803/243
3.213/244
Note: If the data-entry direction arrow points to the right, click the arrow so that it points down.
5. Verify that you entered the data correctly.
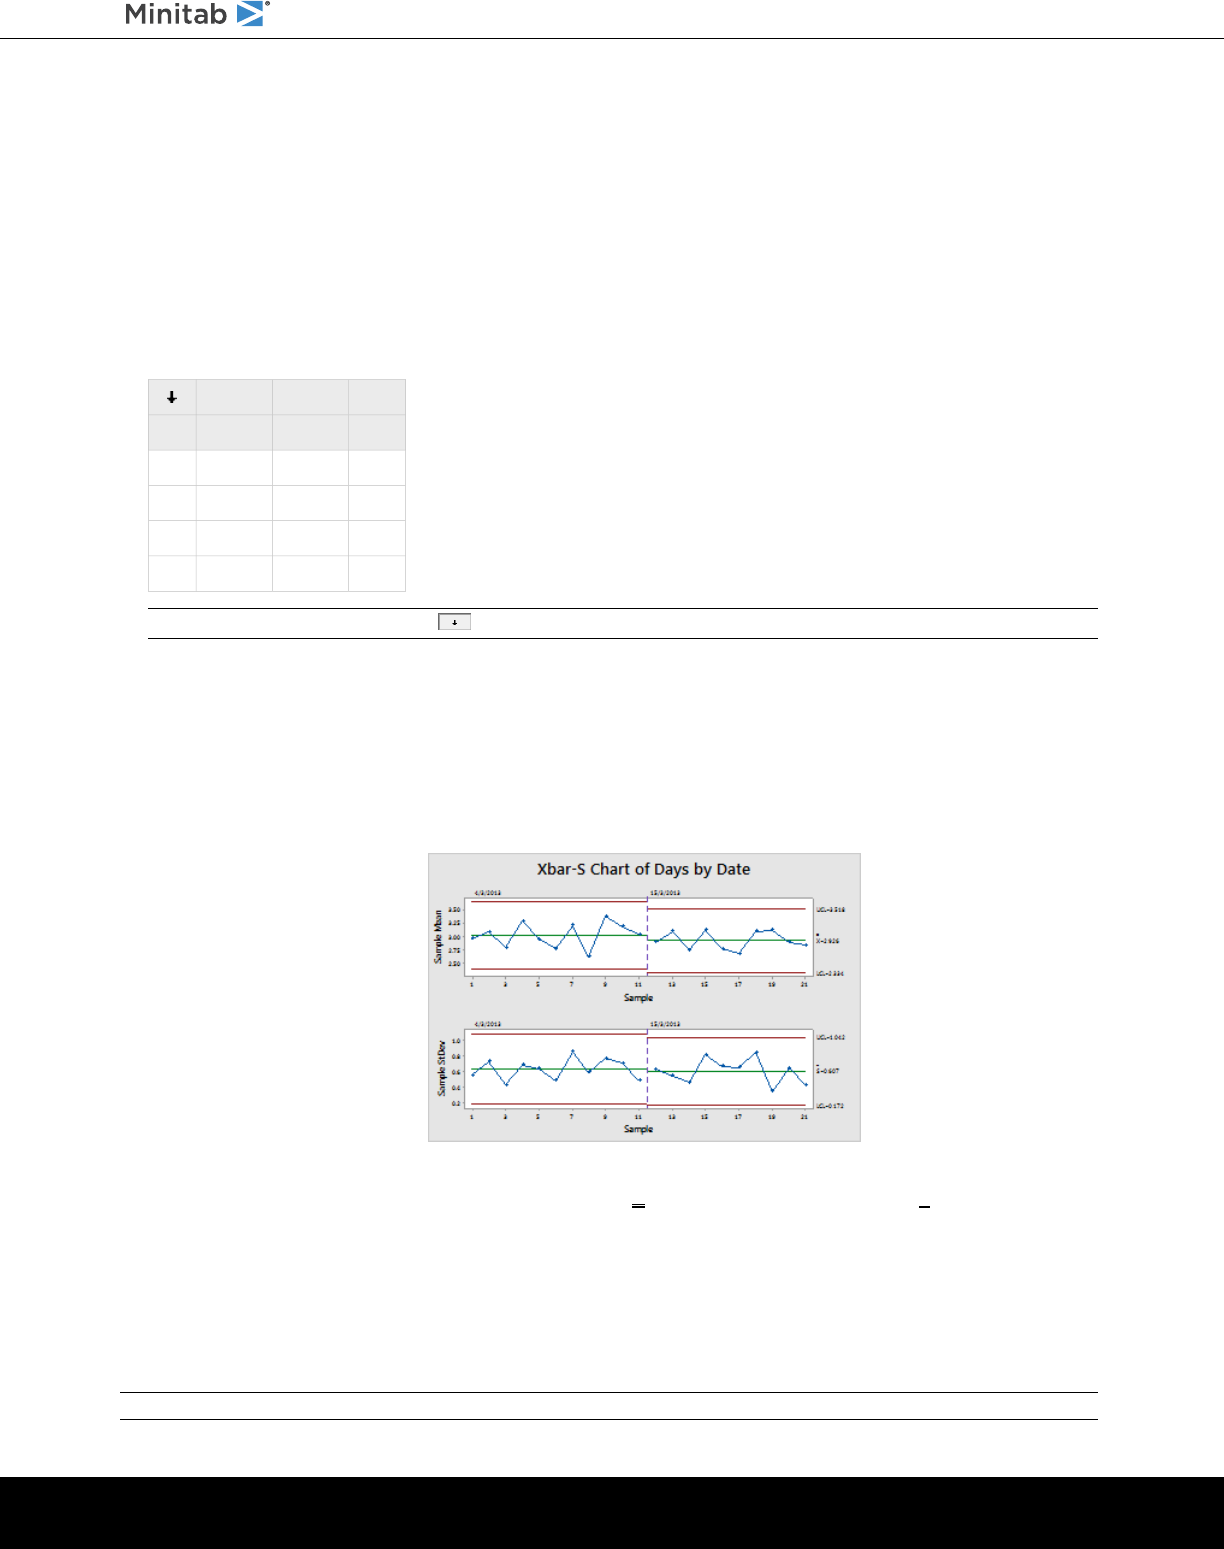
Update the control chart
In the output pane for the Xbar-S chart, under the analysis title, choose Update these results.
Updated Xbar-S chart showing the new subgroup
The Xbar-S chart now includes the new subgroup. The mean (X = 2.926) and standard deviation (S = 0.607) changed
slightly, but the process still appears to be in control.
Add date/time labels to a control chart
By default, the subgroups on Xbar-S charts are labeled in consecutive numeric order. You can edit the x-axis to display
dates instead.
Note: When you use the web app, click Open in Desktop App to complete the following steps.
minitab.com 33
Getting Started with Minitab Statistical Software
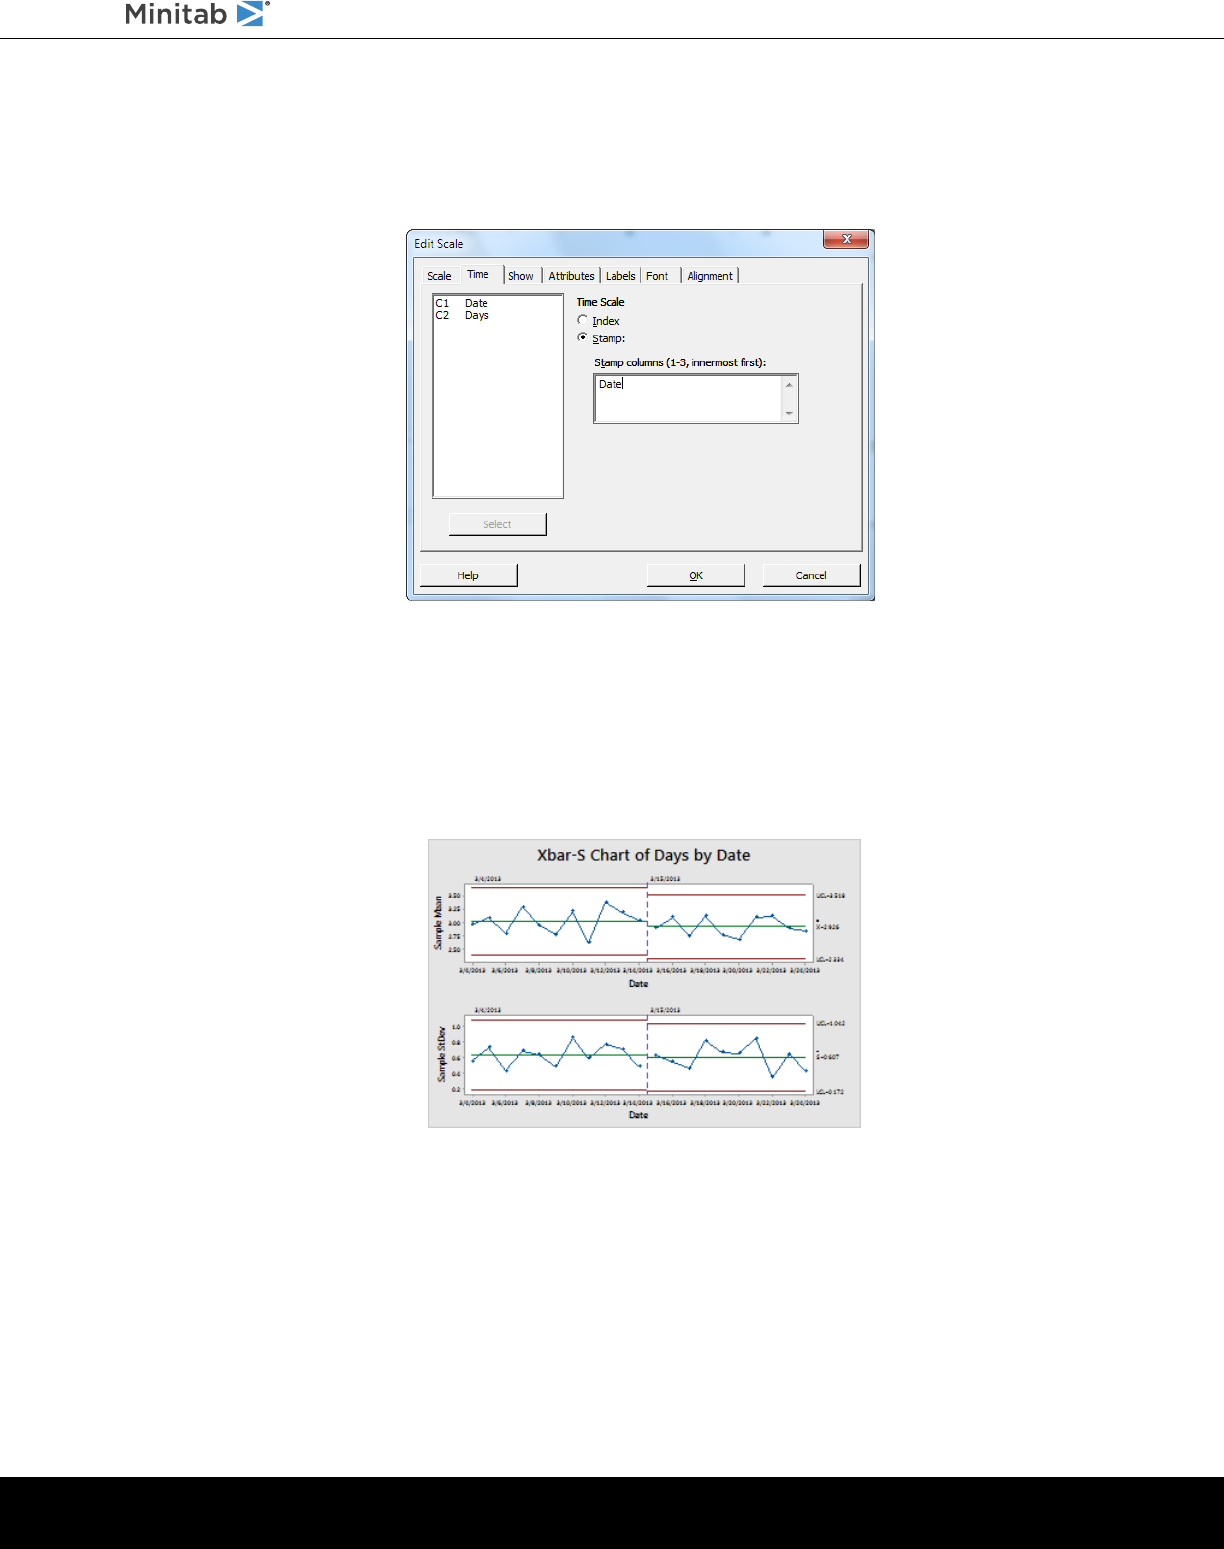
1. Double-click the graph.
2. Double-click the x-axis on the Xbar chart (the top chart).
3. On the Time tab, under Time Scale, select Stamp. In Stamp columns (1-3, innermost first), enter Date.
4. Click OK.
5. Repeat for the x-axis on the S chart.
6. Click OK to update the graph in the output pane.
Xbar-S chart with edited x-axes
Interpret the results
The x-axis for each chart now shows the dates instead of the subgroup numbers.
minitab.com 34
Getting Started with Minitab Statistical Software
Create and interpret capability statistics
After you determine that a process is in statistical control, you want to know whether that process is capable. A process
is capable if it meets specifications and produces good parts or results. You assess process capability by comparing the
spread of the process variation to the width of the specification limits.
Important: Do not assess the capability of a process that is not in control because the estimates of process capability might be incorrect.
Capability indices, or statistics, are a simple way of assessing process capability. Because capability indices reduce
process information to single numbers, comparing one process to another is easy.
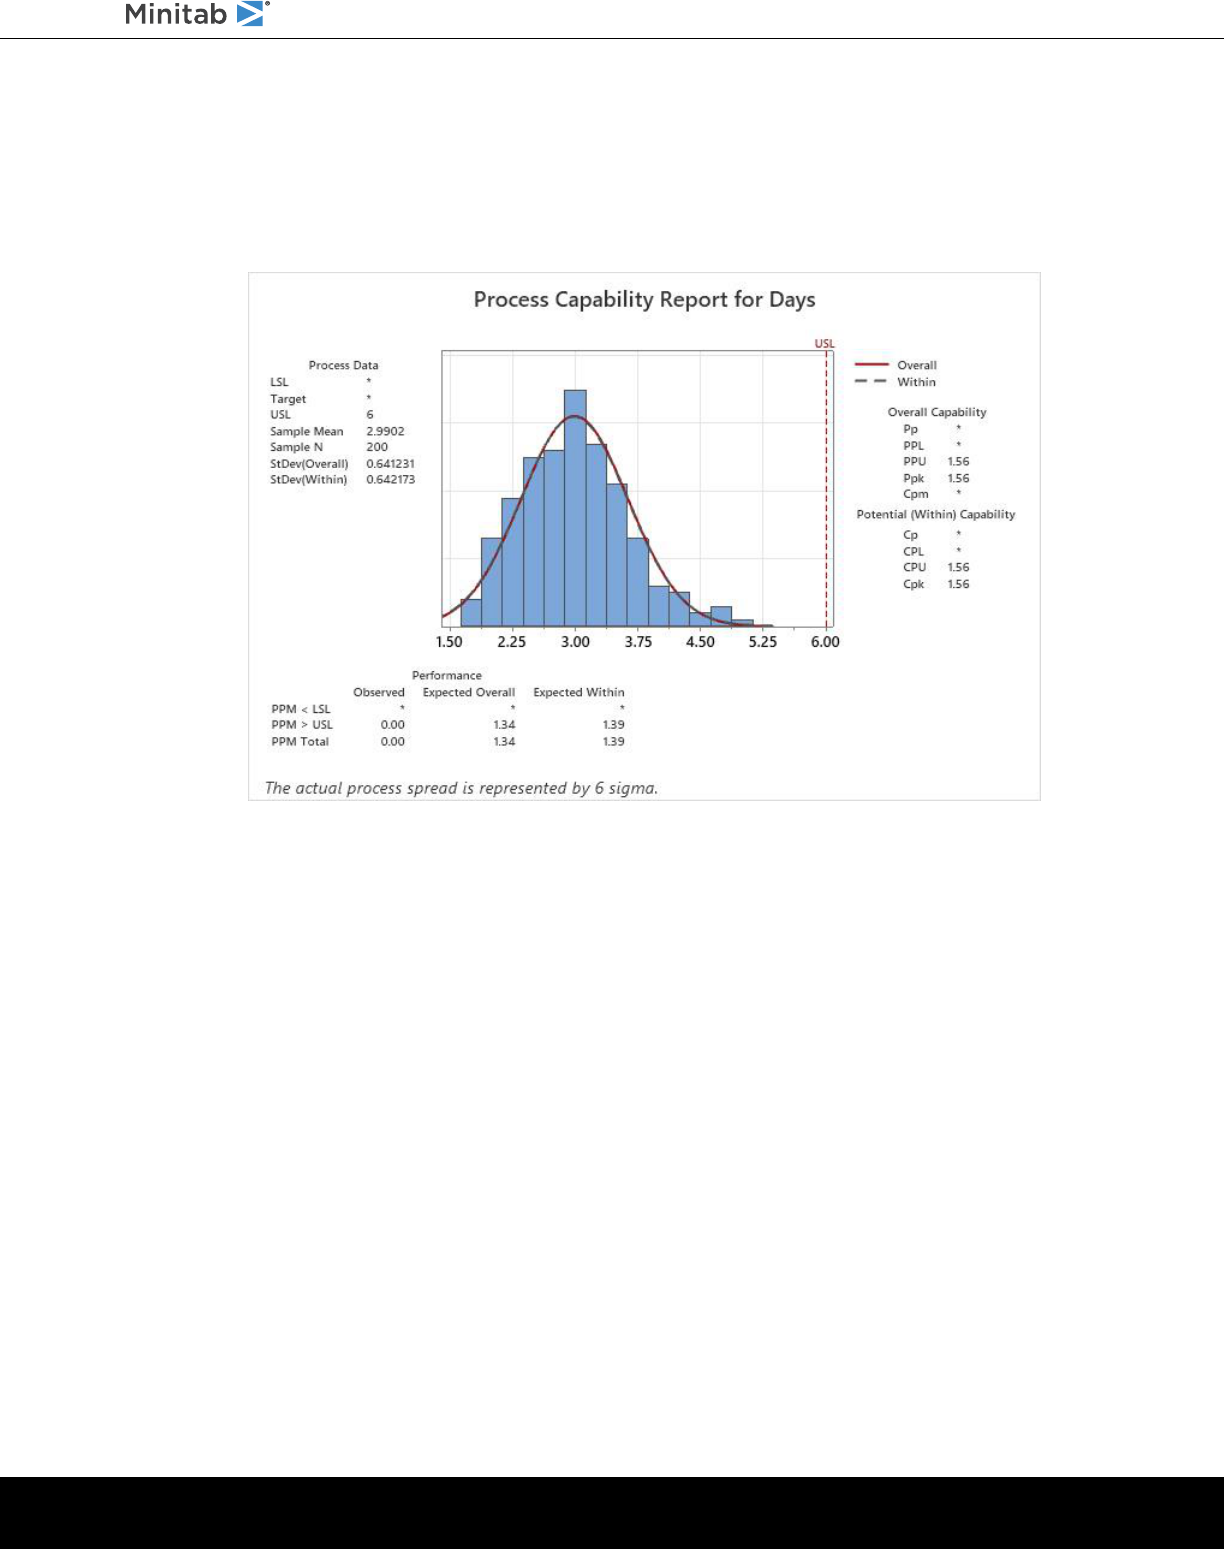
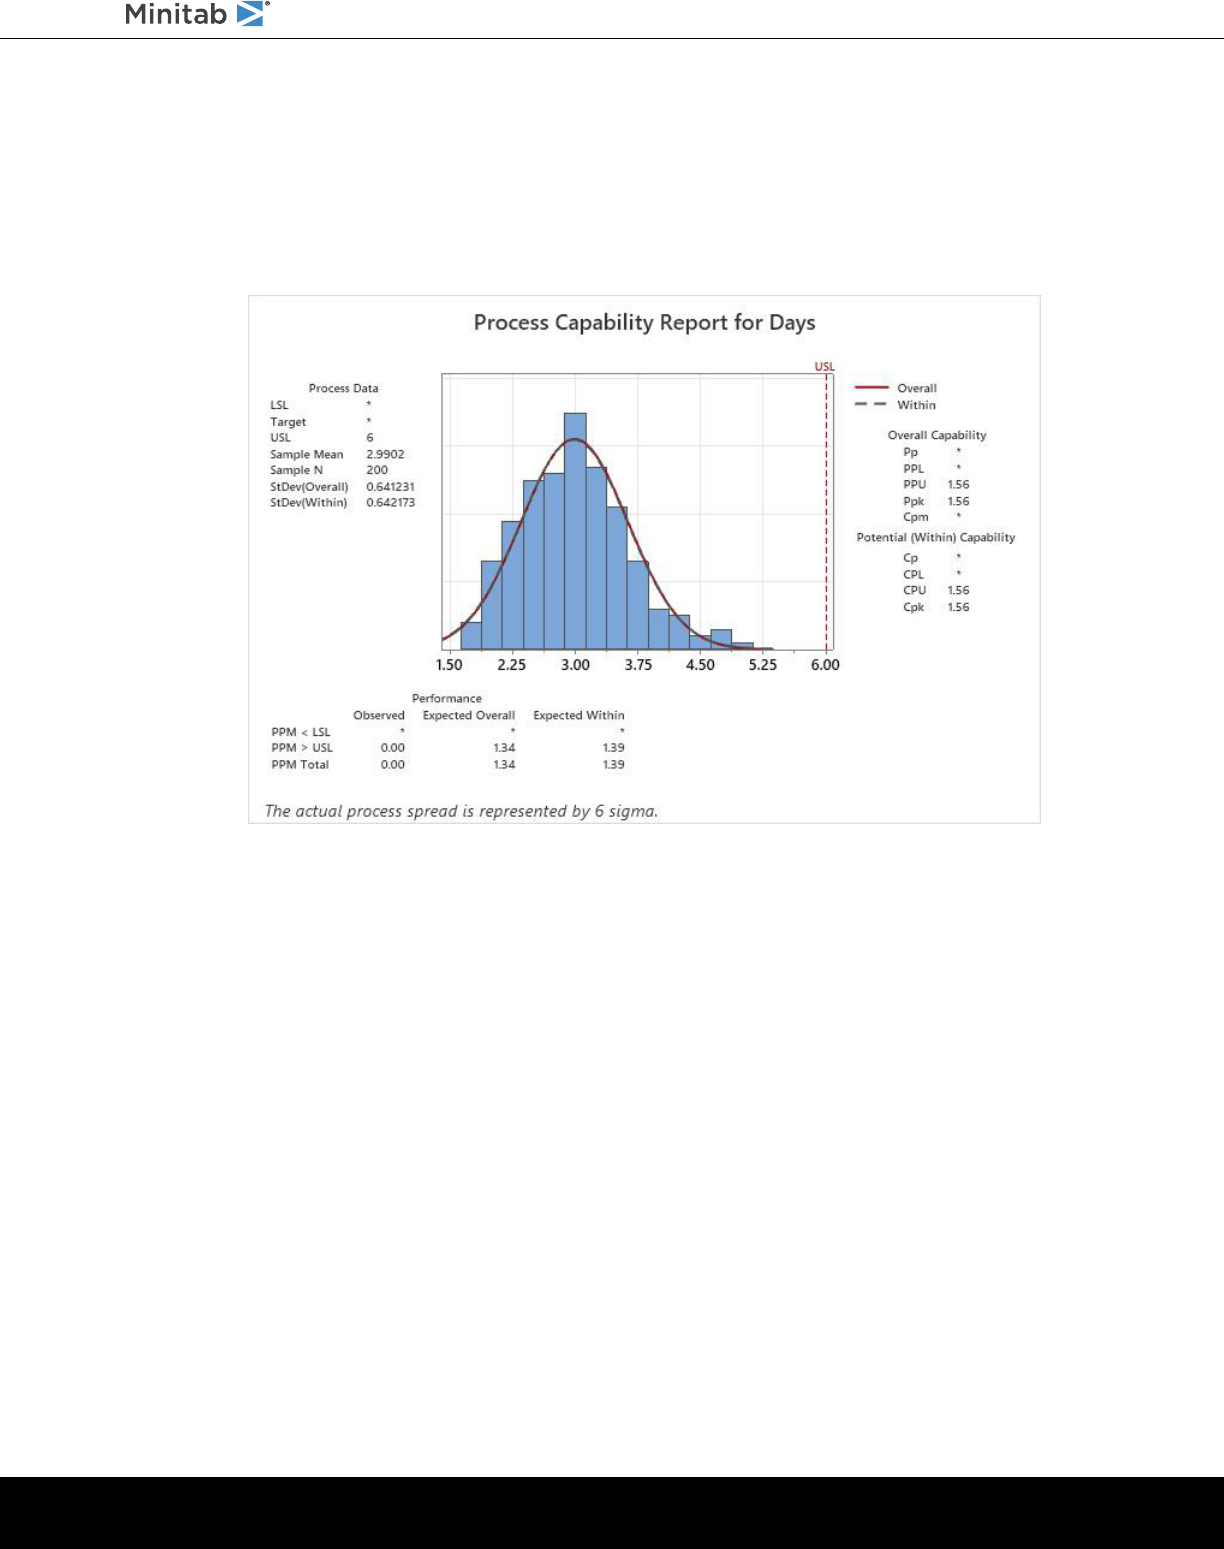
Perform a capability analysis
Now that you know that the delivery process is in control, perform a capability analysis to determine whether the delivery
process is within specification limits and produces acceptable delivery times. The upper specification limit (USL) is 6
because the manager of the Western shipping center considers an order to be late if it is delivered after 6 days. The
manager does not specify a lower specification limit (LSL). The distribution is approximately normal, so you can use a
normal capability analysis.
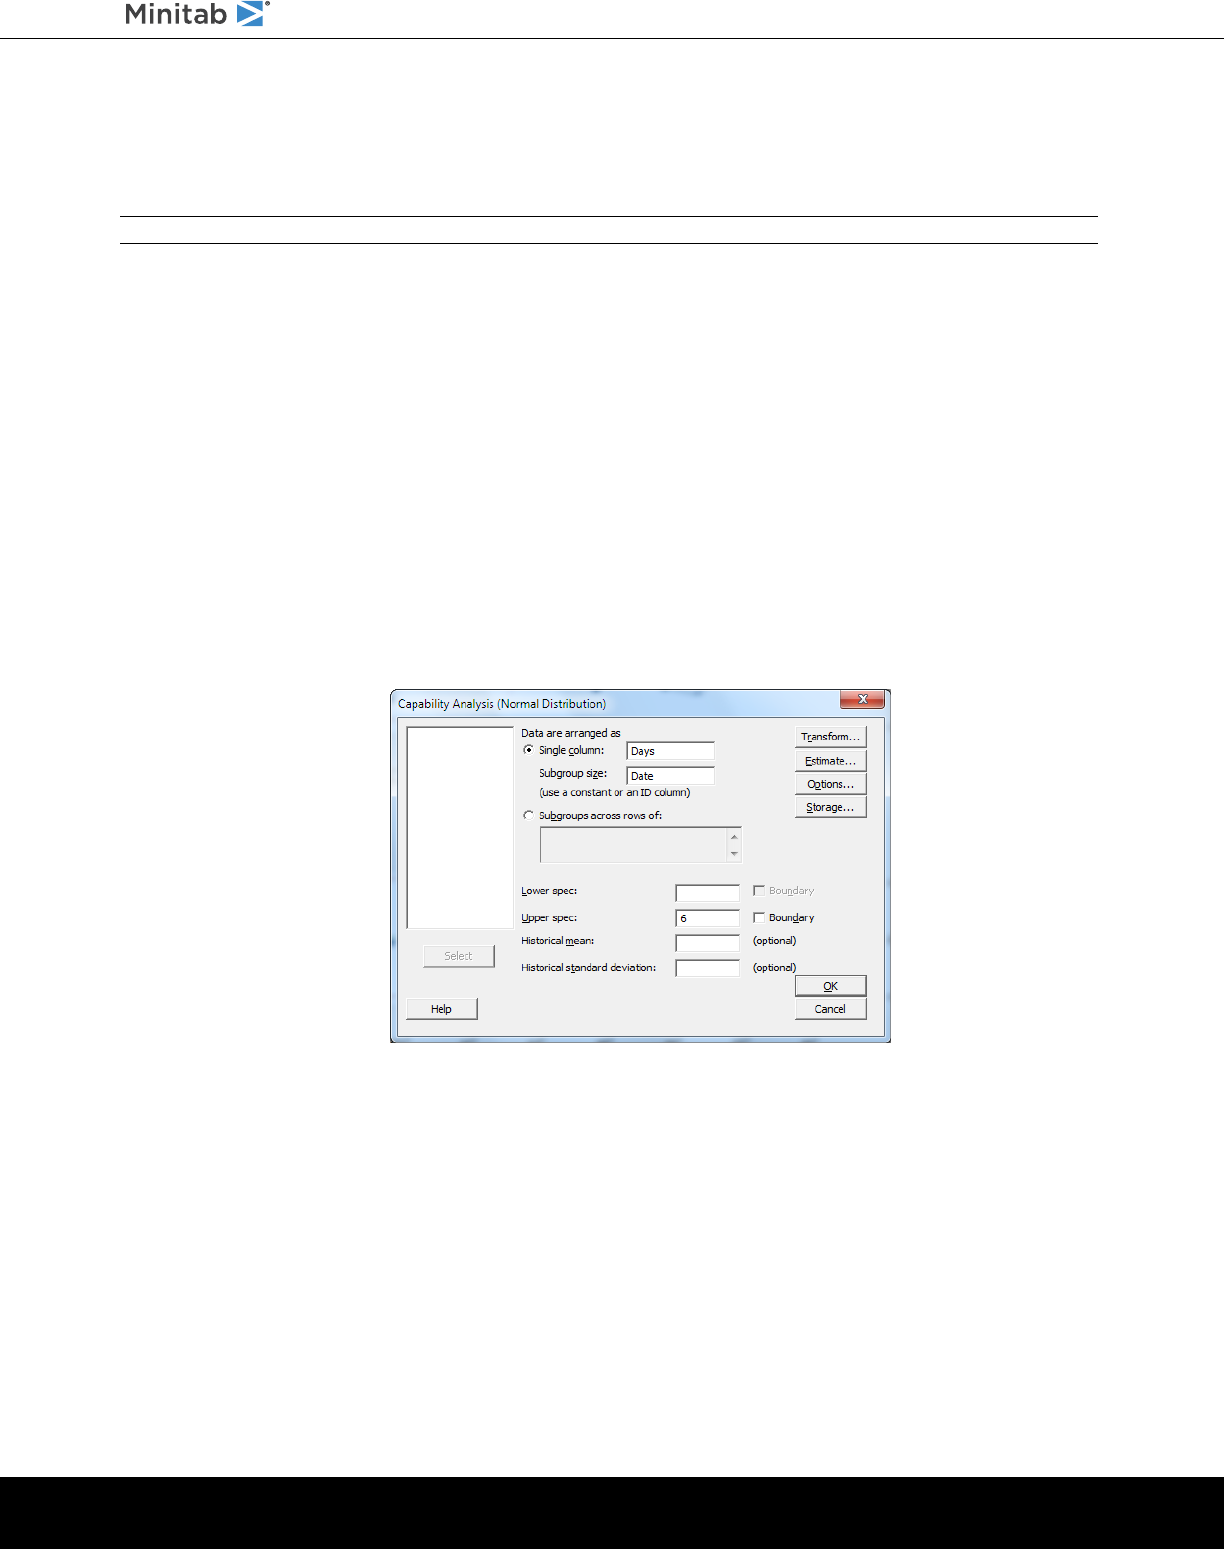
1. Choose Stat > Quality Tools > Capability Analysis > Normal.
2. Under Data are arranged as, select Single column. Enter Days.
3. In Subgroup size, enter Date.
4. In Upper spec, enter 6.
5. Click OK.
minitab.com 35
Getting Started with Minitab Statistical Software
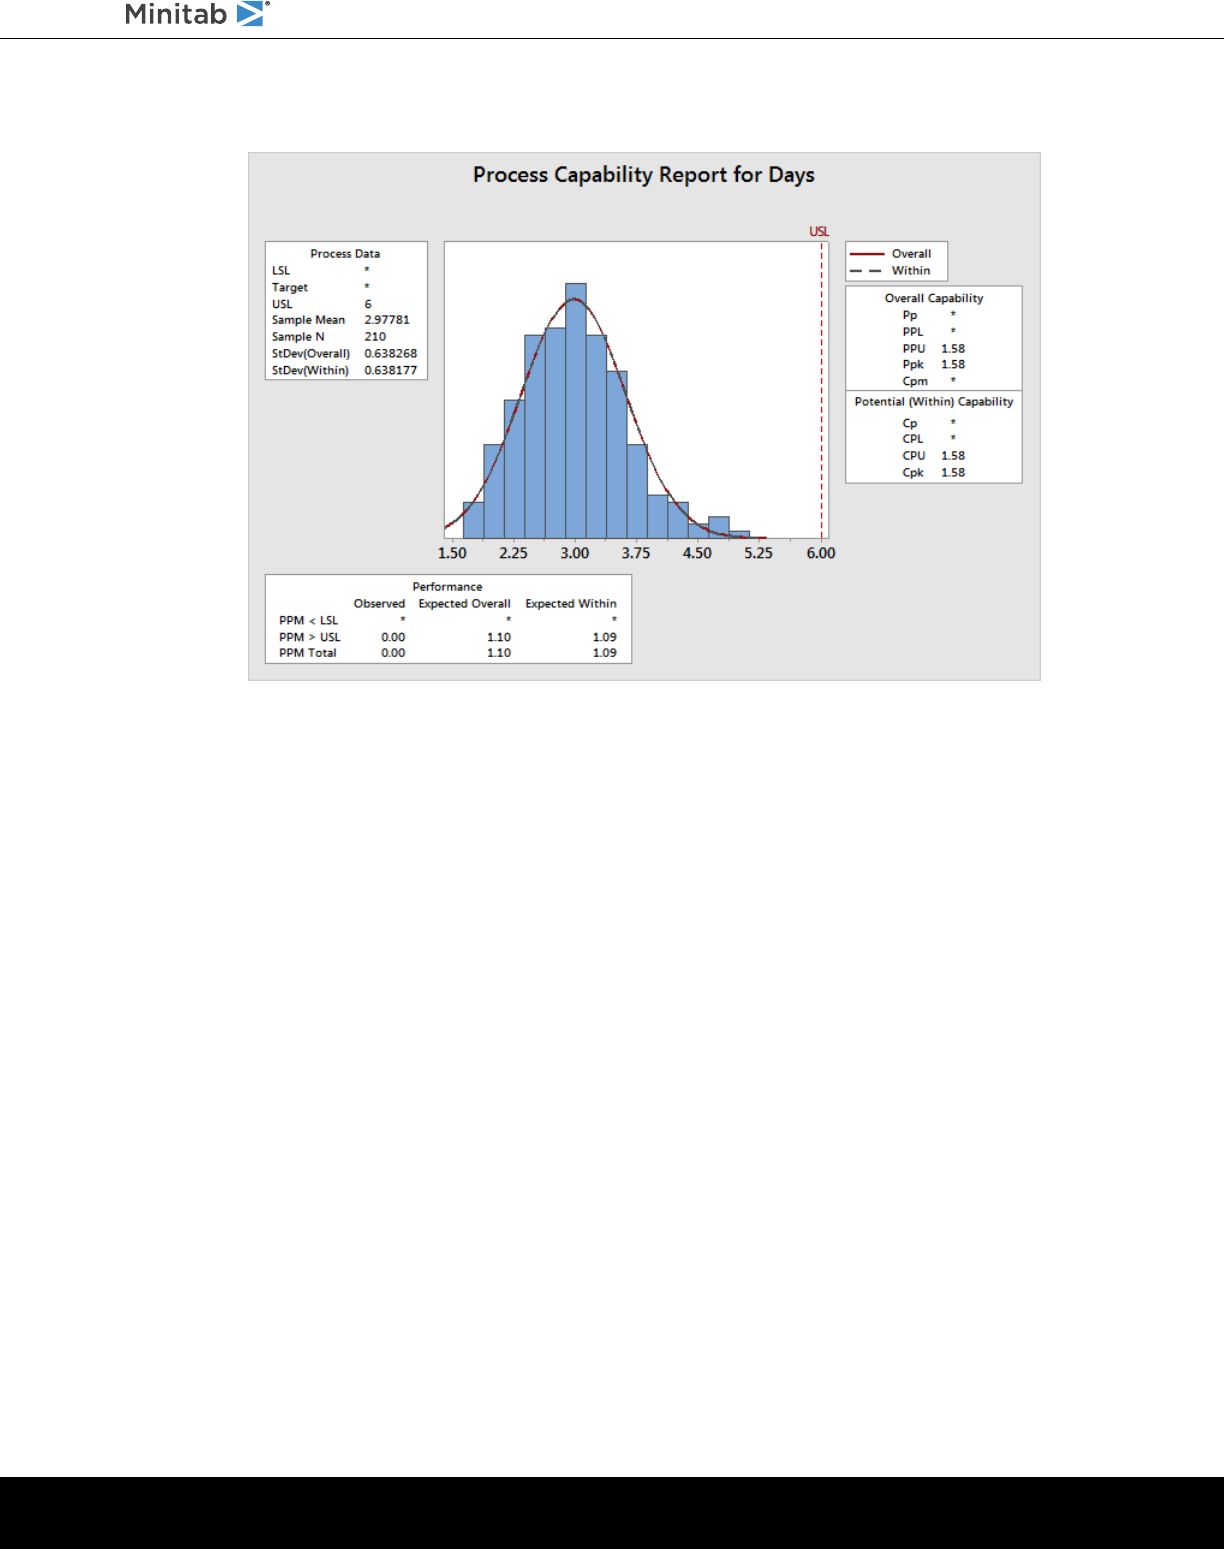
Capability analysis of the delivery process
Interpret the results
Cpk is a measure of potential process capability. Ppk is a measure of overall process capability. Both Cpk and Ppk are
greater than 1.33, which is a generally accepted minimum value. These statistics indicate that the Western shipping center’s
process is capable and that the shipping center delivers orders in an acceptable amount of time.
Save the project
Save all your work in a Minitab project.
1. If you have not already saved your project, choose File > Save Project.
2. Browse to where you want to save your project.
3. Name your project MyQuality.
4. Click Save.
In the next chapter
The quality analysis indicates that the Western shipping center’s process is in control and is capable of meeting specification
limits. In the next chapter, you design an experiment and analyze the results to investigate ways to further improve the
delivery process at the Western shipping center.
minitab.com 36
Getting Started with Minitab Statistical Software
5. Designing an Experiment
Overview
DOE (design of experiments) helps you investigate the effects of input variables (factors) on an output variable (response)
at the same time. These experiments consist of a series of runs, or tests, in which purposeful changes are made to the
input variables. Data are collected at each run. You use DOE to identify the process conditions and product components
that affect quality, and then determine the factor settings that optimize results.
Minitab offers five types of designs: screening designs, factorial designs, response surface designs, mixture designs, and
Taguchi designs (also called Taguchi robust designs). The steps you follow in Minitab to create, analyze, and visualize a
designed experiment are similar for all types. After you perform the experiment and enter the results, Minitab provides
several analytical tools and graph tools to help you understand the results. This chapter demonstrates the typical steps
to create and analyze a factorial design. You can apply these steps to any design that you create in Minitab.
Minitab DOE commands include the following features:
•
Catalogs of designed experiments to help you create a design
•
Automatic creation and storage of your design after you specify its properties
•
Display and storage of diagnostic statistics to help you interpret the results
•
Graphs to help you interpret and present the results
In this chapter, you investigate two factors that might decrease the time that is needed to prepare an order for shipment:
the order-processing system and the packing procedure.
The Western center has a new order-processing system. You want to determine whether the new system decreases the
time that is needed to prepare an order. The center also has two different packing procedures. You want to determine
which procedure is more efficient. You decide to perform a factorial experiment to test which combination of factors
enables the shortest time that is needed to prepare an order for shipment.
Create a designed experiment
Before you can enter or analyze DOE data in Minitab, you must first create a designed experiment in the worksheet.
Minitab offers a variety of designs.
Screening
Includes definitive screening and Plackett-Burman designs.
Factorial
Includes 2-level full designs, 2-level fractional designs, split-plot designs, and Plackett-Burman designs.
Response surface
Includes central composite designs and Box-Behnken designs.
Mixture
Includes simplex centroid designs, simplex lattice designs, and extreme vertices designs.
Taguchi
Includes 2-level designs, 3-level designs, 4-level designs, 5-level designs, and mixed-level designs.
You choose the appropriate design based on the requirements of your experiment. Choose the design from the Stat >
DOE menu. After you choose the design and its features, Minitab creates the design and stores it in the worksheet.
Tip: You can open a toolbar for each type of design by choosing View > Toolbars.
minitab.com 37
Getting Started with Minitab Statistical Software
Select a factorial design to examine two factors
You want to create a factorial design to examine the relationship between two factors, order-processing system and
packing procedure, and the time that is needed to prepare an order for shipping.
1. Choose File > New > Project.
2. Choose Stat > DOE > Factorial > Create Factorial Design.
When you create a design in Minitab, only two buttons are enabled, Display Available Designs and Designs. The
other buttons are enabled after you complete the Designs sub-dialog box.
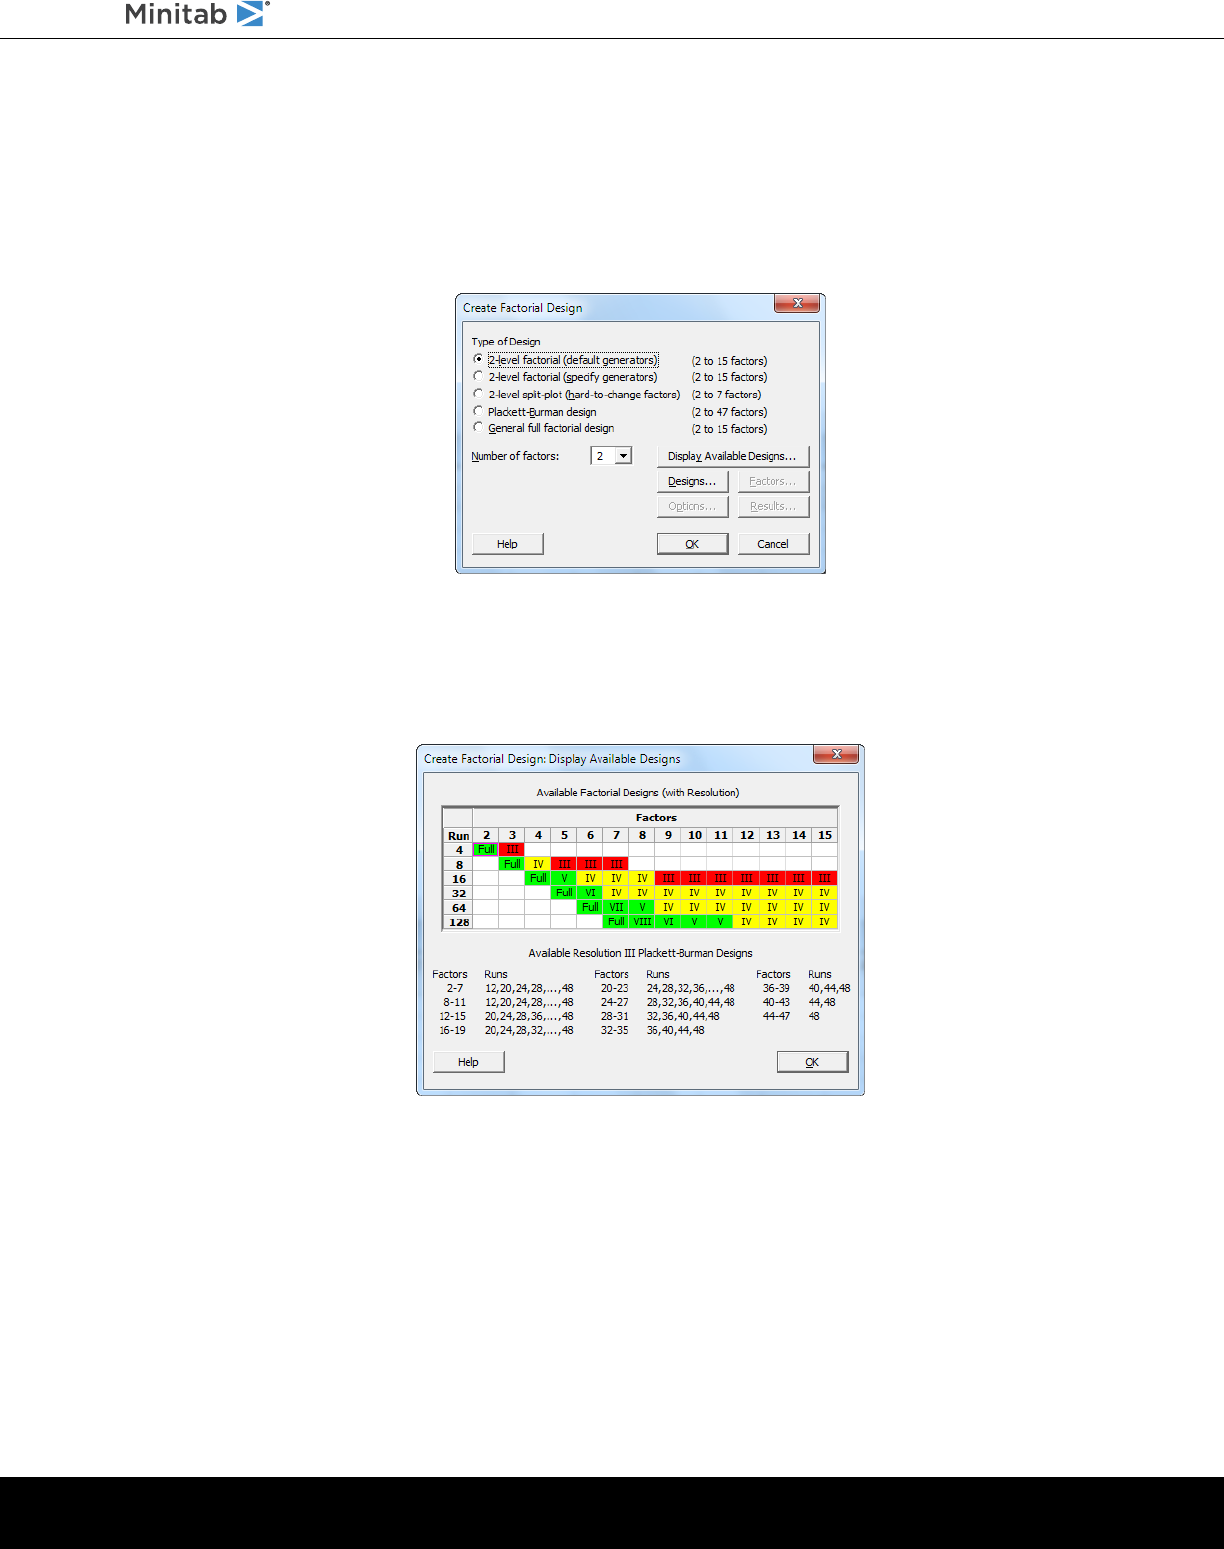
3. Click Display Available Designs.
For most design types, Minitab displays all the possible designs and the number of required experimental runs in the
Display Available Designs dialog box.
4. Click OK to return to the main dialog box.
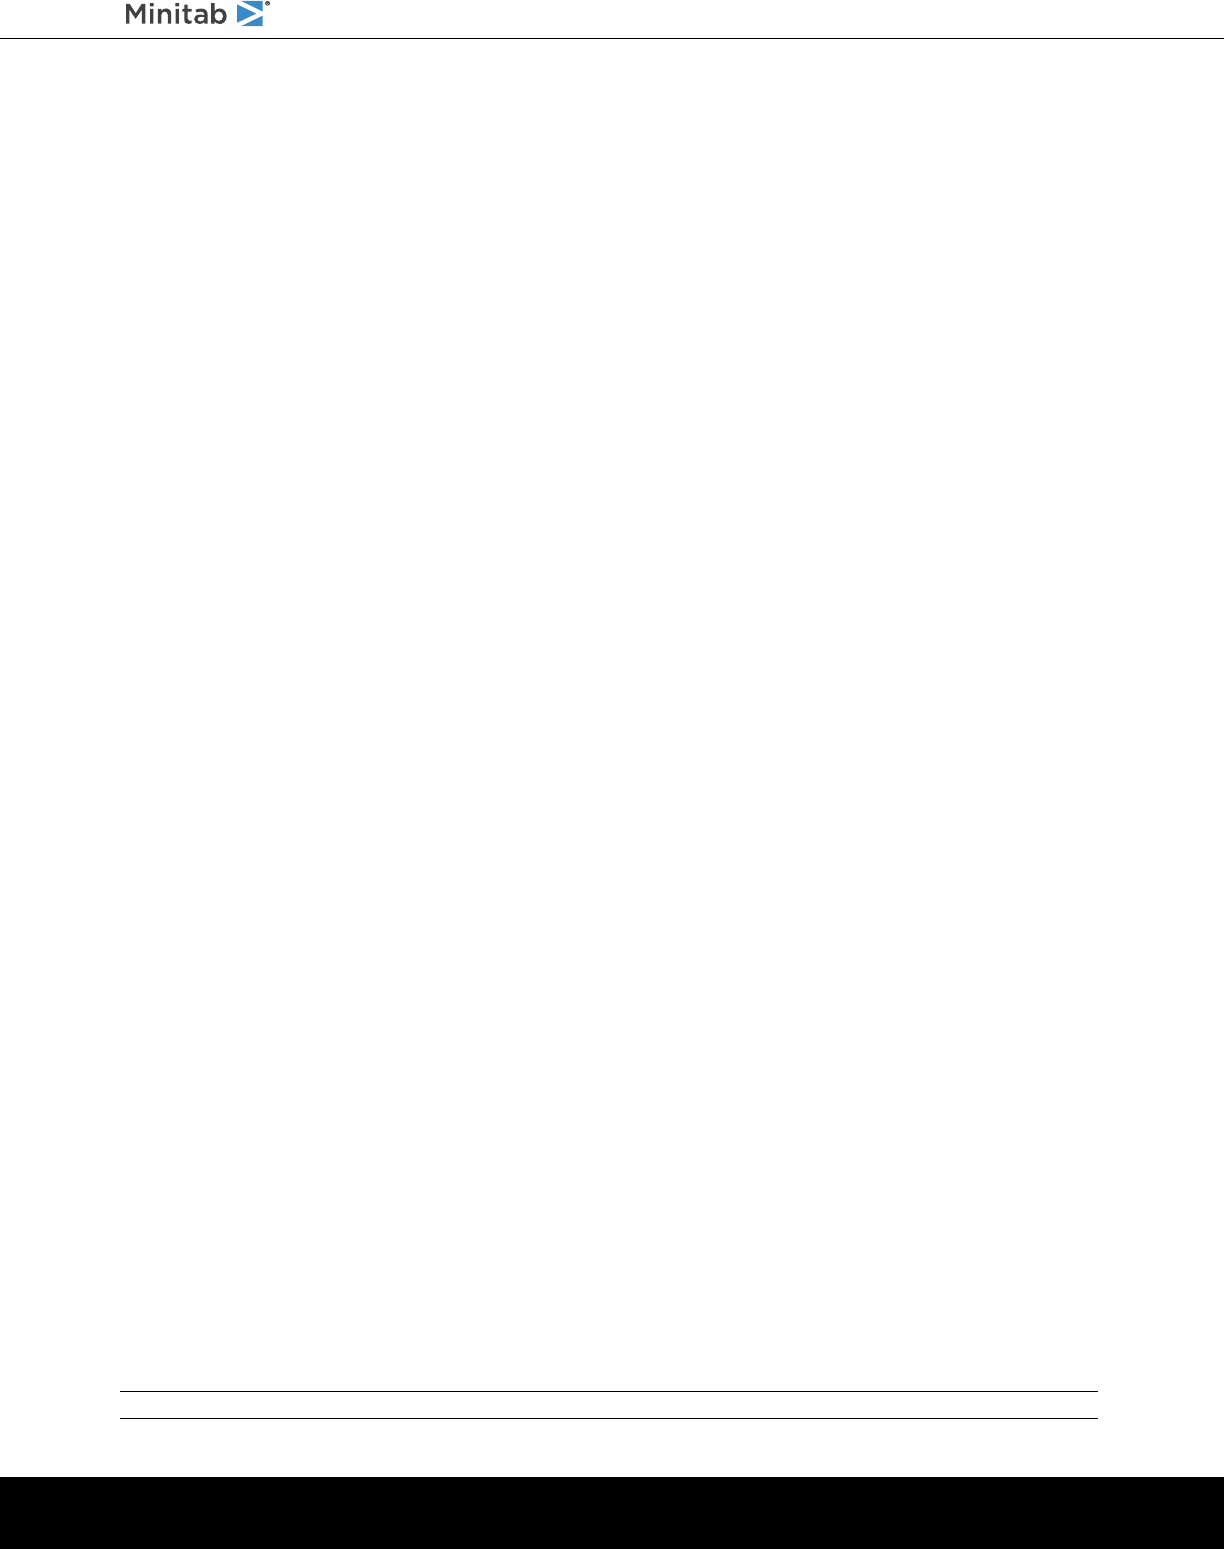
5. Under Type of Design, select 2-level factorial (default generators).
6. From Number of factors, select 2.
minitab.com 38
Getting Started with Minitab Statistical Software
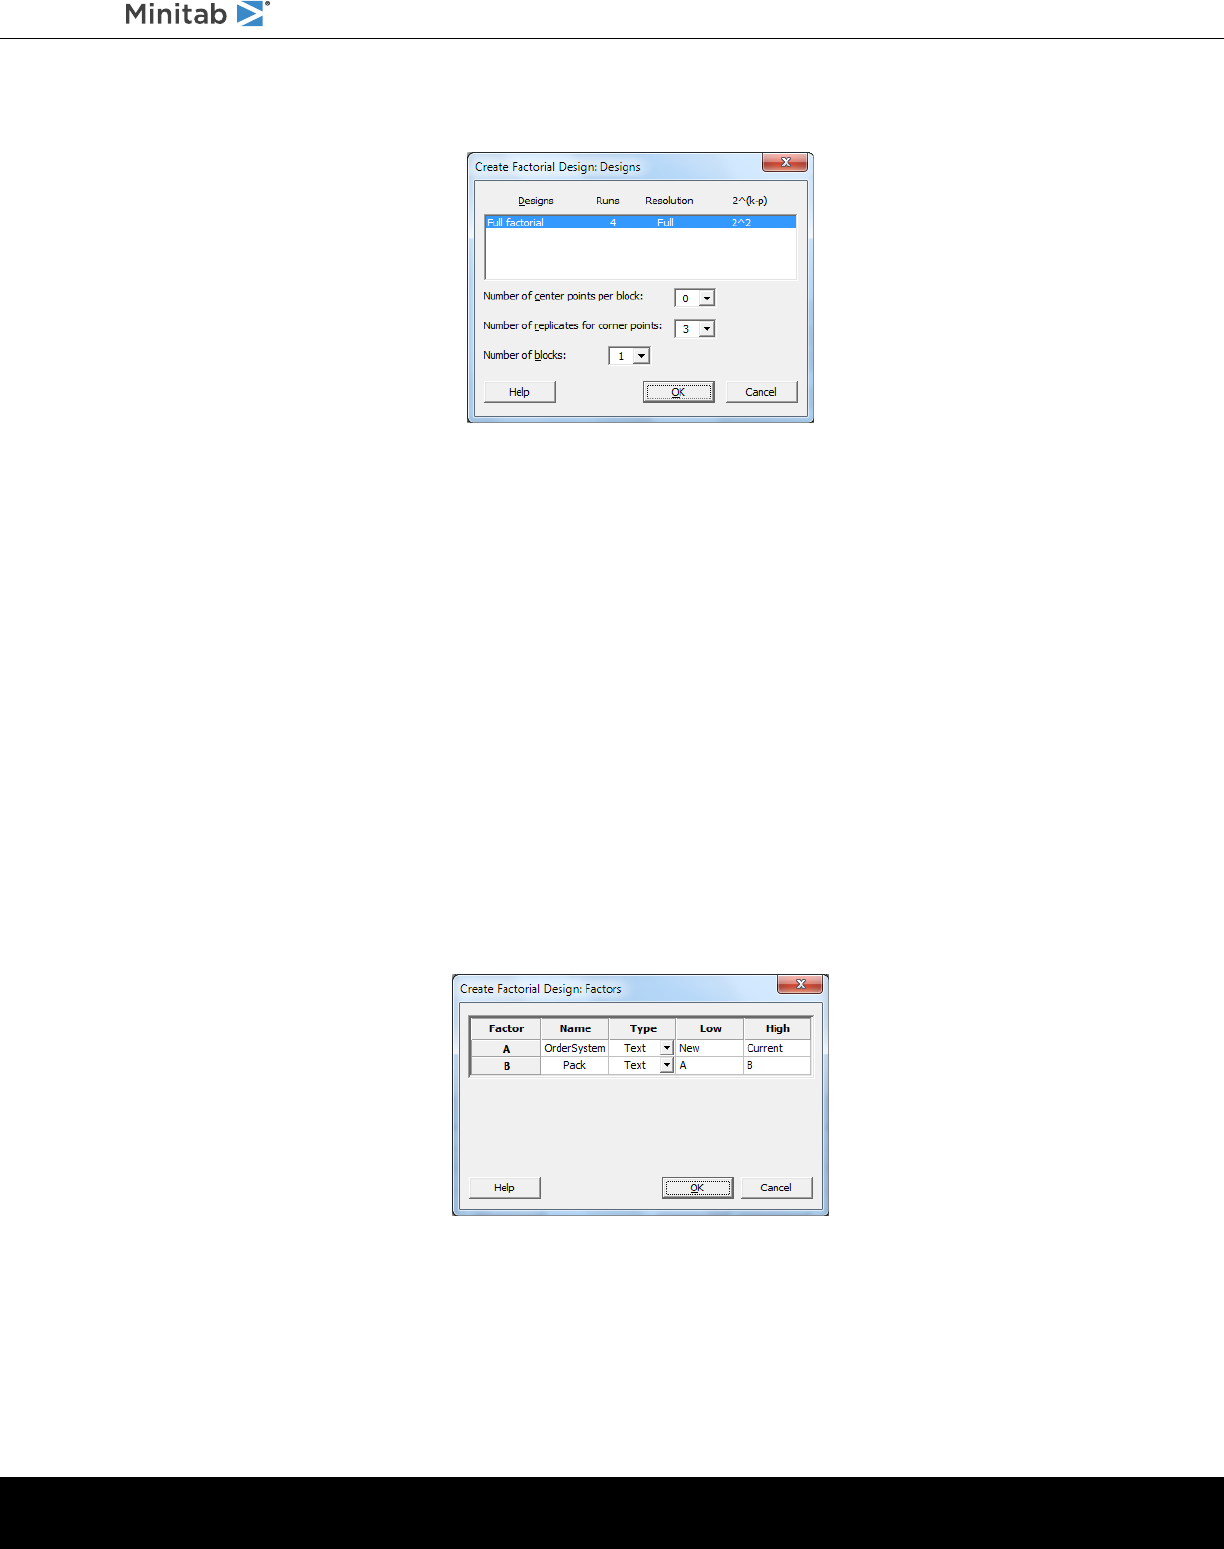
7. Click Designs.
The area at the top of the sub-dialog box shows available designs for the design type and the number of factors that
you chose. In this example, because you are performing a factorial design with two factors, you have only one option,
a full factorial design with four experimental runs. A 2-level design with two factors has 2
2
(four) possible factor
combinations.
8. From Number of replicates for corner points, select 3.
9. Click OK to return to the main dialog box.
All the buttons are now enabled.
Enter the factor names and set the factor levels
Minitab uses the factor names as the labels for the factors on the analysis output and graphs. If you do not enter factor
levels, Minitab sets the low level at −1 and the high level at 1.
1. Click Factors.
2. In the row for Factor A, under Name, enter OrderSystem. Under Type, select Text. Under Low, enter New. Under
High, enter Current.
3. In the row for Factor B, under Name, enter Pack. Under Type, select Text. Under Low, enter A. Under High, enter B.
4. Click OK to return to the main dialog box.
minitab.com 39
Getting Started with Minitab Statistical Software
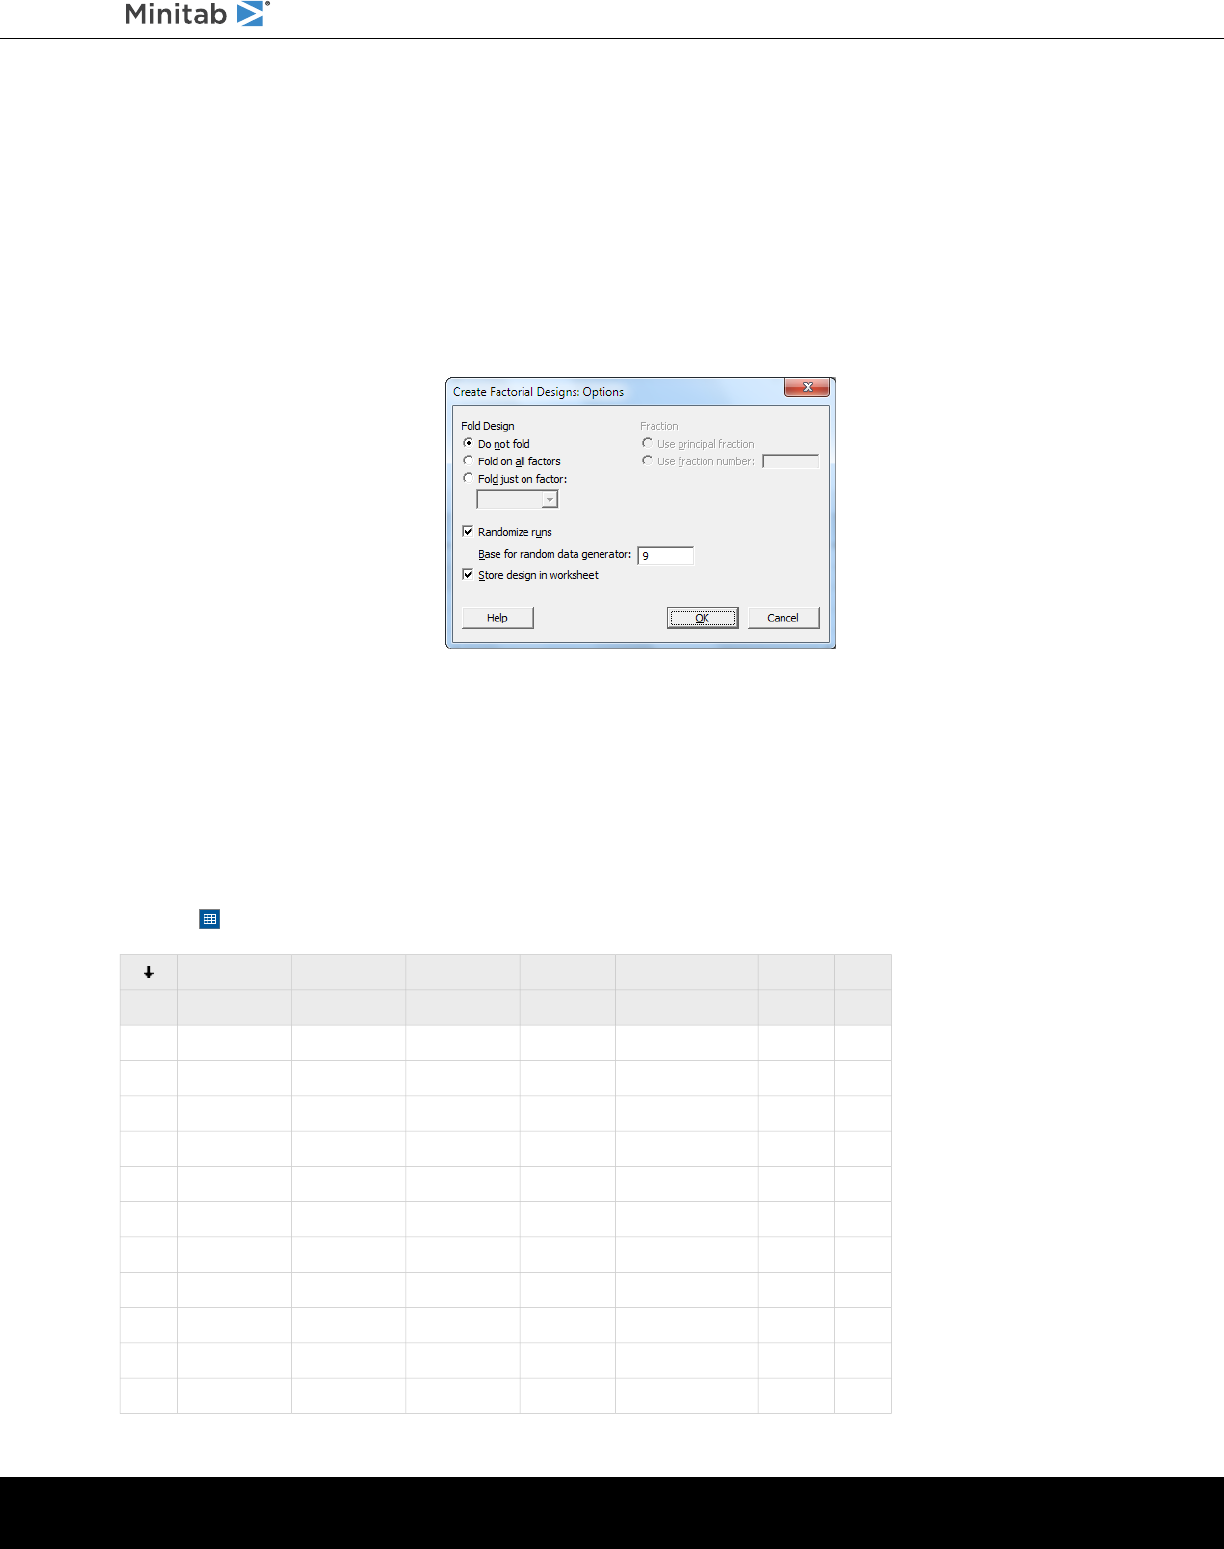
Randomize and store the design
By default, Minitab randomizes the run order of all design types, except Taguchi designs. Randomization helps ensure
that the model meets certain statistical assumptions. Randomization can also help reduce the effects of factors that are
not included in the study.
Setting the base for the random data generator ensures that you obtain the same run order each time you create the
design.
1. Click Options.
2. In Base for random data generator, enter 9.
3. Verify that Store design in worksheet is selected.
4. Click OK in each dialog box.
View the design
Each time you create a design, Minitab stores design information and factors in worksheet columns.
1. Click on the status bar to more easily see the structure of a typical design in the worksheet.
C7C6-TC5-TC4C3C2C1
PackOrderSystemBlocksCenterPtRunOrderStdOrder
ACurrent11121
BNew112112
BCurrent11343
BNew11434
ANew11515
BCurrent116126
ACurrent117107
BNew11878
ACurrent11969
BCurrent1110810
ANew1111511
minitab.com 40
Getting Started with Minitab Statistical Software
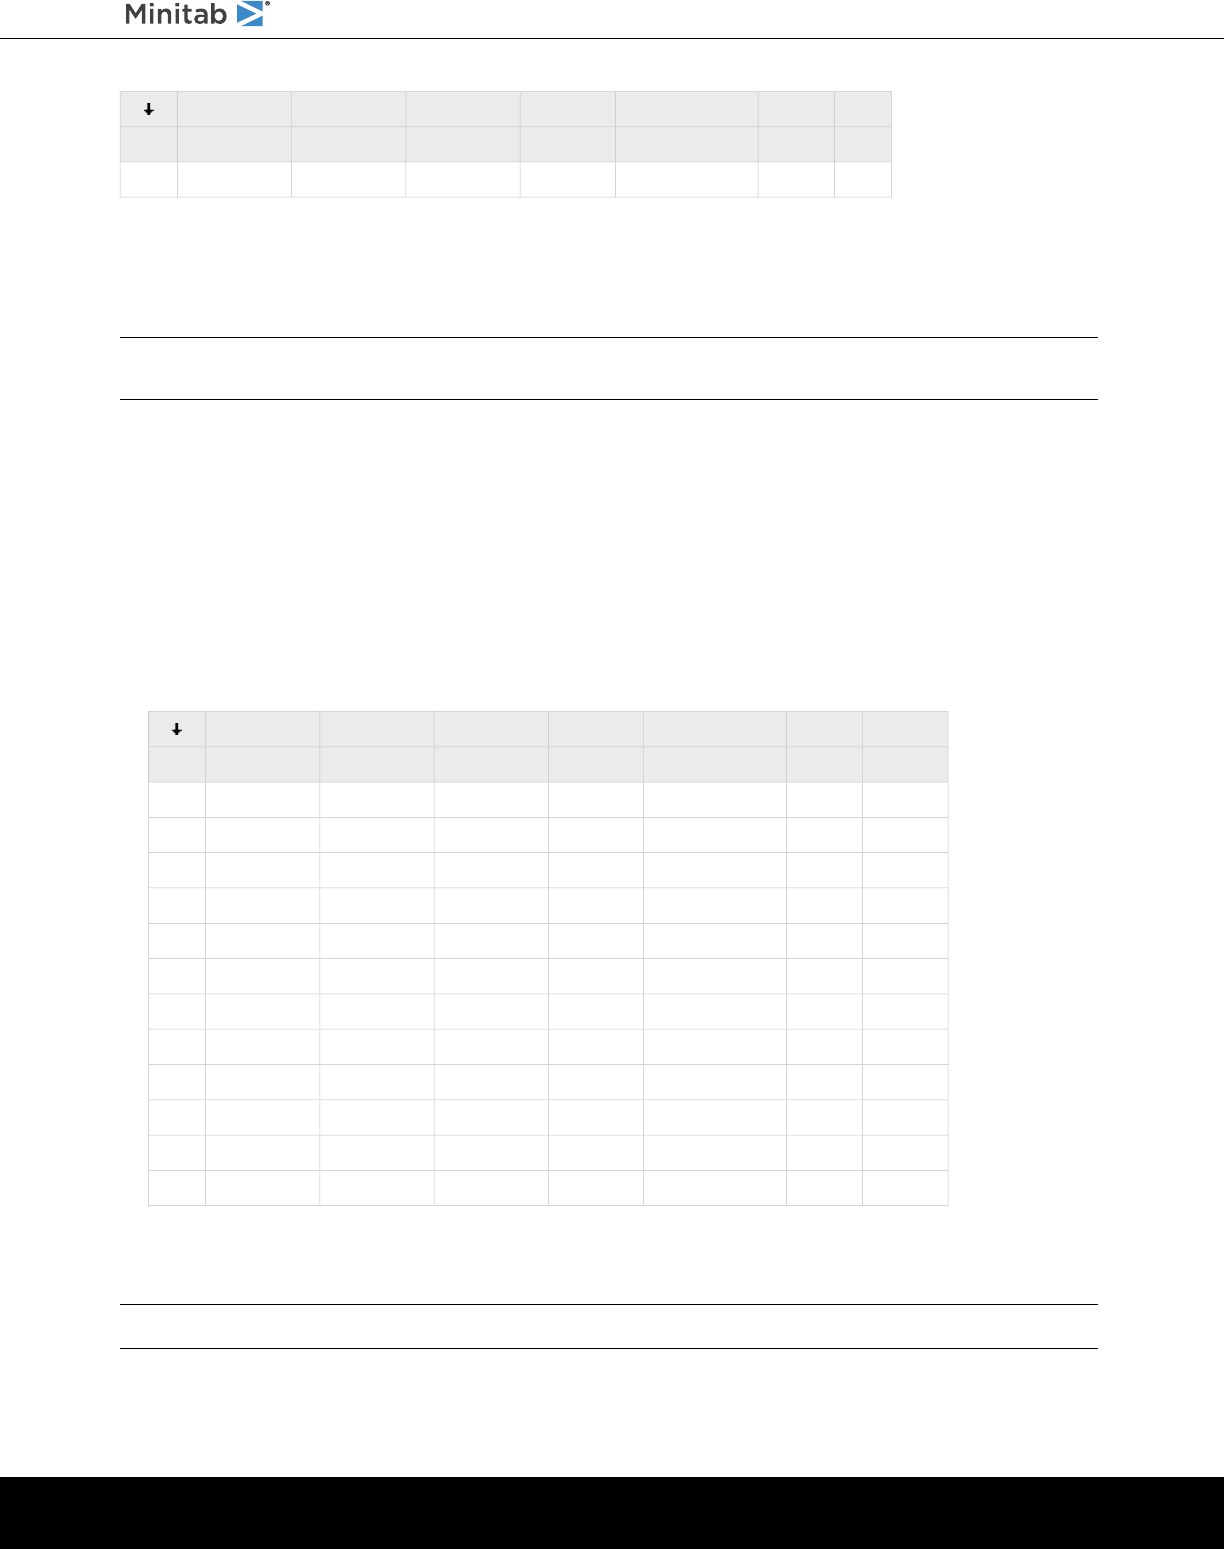
C7C6-TC5-TC4C3C2C1
PackOrderSystemBlocksCenterPtRunOrderStdOrder
ANew1112912
The RunOrder column (C2) indicates the order to collect data. If you do not randomize the design, the StdOrder and
RunOrder columns are the same.
In this example, because you did not add center points or put runs into blocks, Minitab sets all the values in C3 and C4
to 1. The factors that you entered are stored in columns C5 (OrderSystem) and C6 (Pack).
Note: You can use Stat > DOE > Display Design to switch between a random display and a standard-order display, and between a coded
display and an uncoded display. To change the factor settings or names, use Stat > DOE > Modify Design. If you need to change only the factor
names, you can enter them directly in the worksheet.
Enter data into the worksheet
After you perform the experiment and collect the data, you can enter the data into the worksheet.
The characteristic that you measure is called a response. In this example, you measure the number of hours that are
needed to prepare an order for shipment. You obtain the following data from the experiment:
14.72 9.62 13.81 7.97 12.52 13.78 14.64 9.41 13.89 13.89 12.57 14.06
1. In the worksheet, click the column name cell of C7 and enter Hours.
2. In the Hours column, enter the data as shown below.
C7C6-TC5-TC4C3C2C1
HoursPackOrderSystemBlocksCenterPtRunOrderStdOrder
14.72ACurrent11121
9.62BNew112112
13.81BCurrent11343
7.97BNew11434
12.52ANew11515
13.78BCurrent116126
14.64ACurrent117107
9.41BNew11878
13.89ACurrent11969
13.89BCurrent1110810
12.57ANew1111511
14.06ANew1112912
You can enter data in any columns except in columns that contain design information. You can also enter multiple
responses for an experiment, one response per column.
Note: To print a data collection form, click in the worksheet and choose File > Print. Verify that Print Grid Lines is selected. Use the form to
record measurements during the experiment.
minitab.com 41
Getting Started with Minitab Statistical Software
Analyze the design and interpret the results
After you create a design and enter the response data, you can fit a model to the data and generate graphs to assess
the effects. Use the results from the fitted model and graphs to determine which factors are important to reduce the
number of hours that are needed to prepare an order for shipment.
Fit a model
Because the worksheet contains a factorial design, Minitab enables the DOE > Factorial menu commands, Analyze
Factorial Design and Cube Plot. In this example, you fit the model first.
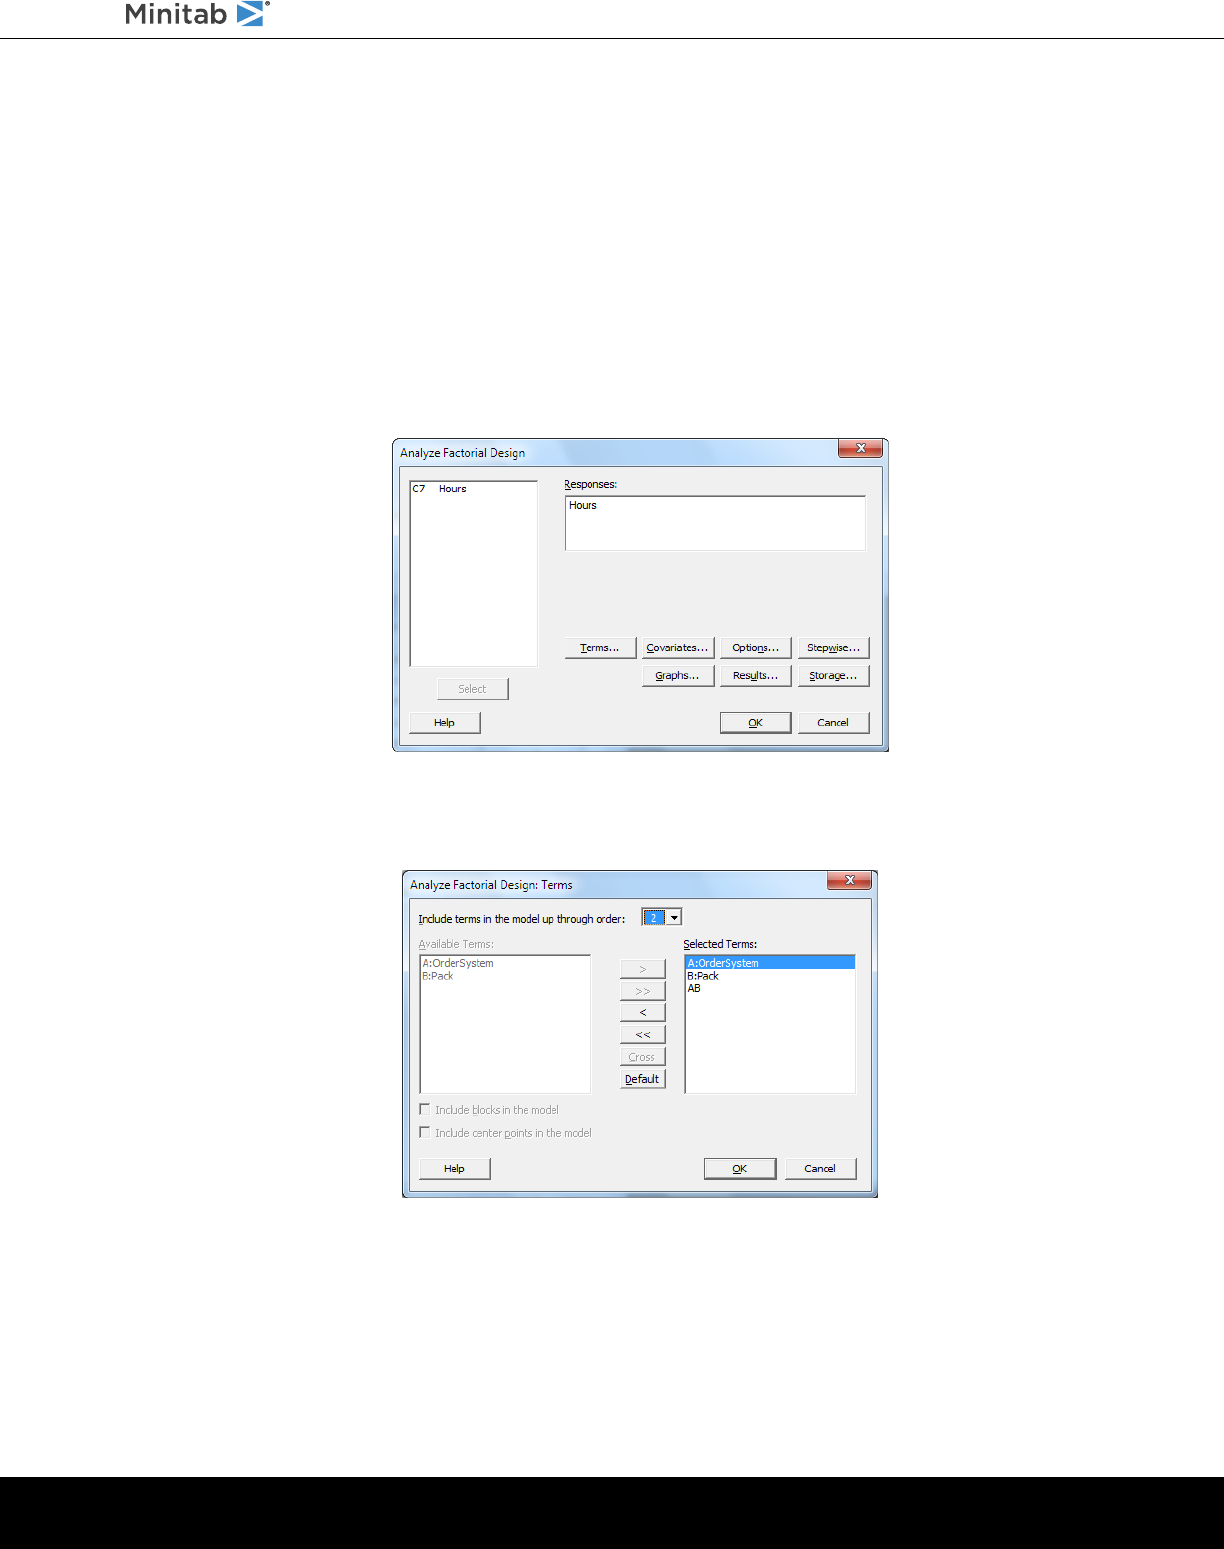
1. Choose Stat > DOE > Factorial > Analyze Factorial Design.
2. In Responses, enter Hours.
3. Click Terms. Verify that A:OrderSystem, B:Pack, and AB are in the Selected Terms box.
When you analyze a design, always use the Terms sub-dialog box to select the terms to include in the model. You
can add or remove factors and interactions by using the arrow buttons. Use the check boxes to include blocks and
center points in the model.
4. Click OK.
5. Click Graphs.
minitab.com 42
Getting Started with Minitab Statistical Software
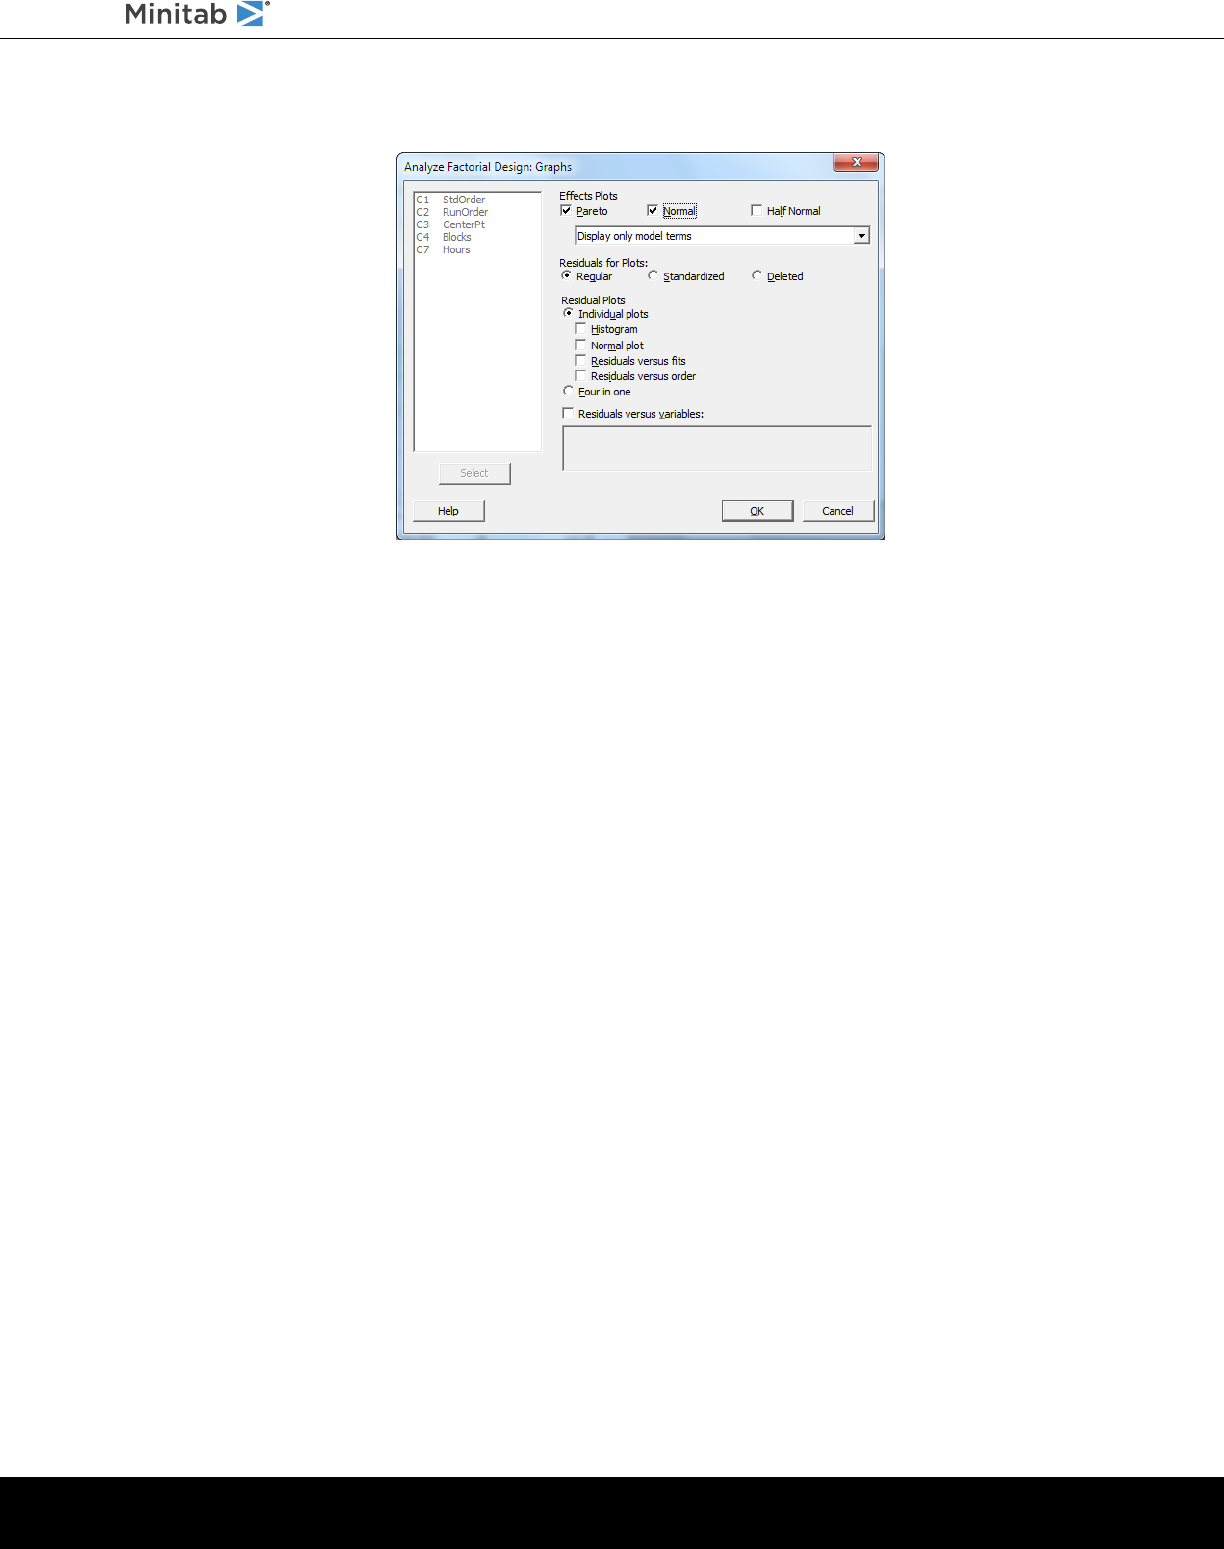
6. Under Effects Plots, select Pareto and Normal.
Effects plots are available only in factorial designs, screening designs, and response surface designs. Residual plots,
which you use to verify model assumptions, can be displayed for all design types.
7. Click OK in each dialog box.
Minitab fits the model that you defined in the Terms sub-dialog box, displays the results in the output pane, and stores
the model in the worksheet file. After you identify an acceptable model, you can use the stored model to perform
subsequent analyses.
Identify important effects
You use the tables and the two effects plots to determine which effects are important to your process. First, look at the
tables.
Factorial Regression: Hours versus OrderSystem, Pack
Coded Coefficients
Term Effect Coef SE Coef T-Value P-Value VIF
Constant 12.573 0.193 65.20 0.000
OrderSystem 3.097 1.548 0.193 8.03 0.000 1.00
Pack -2.320 -1.160 0.193 -6.01 0.000 1.00
OrderSystem*Pack 1.730 0.865 0.193 4.49 0.002 1.00
Model Summary
S R-sq R-sq(adj) R-sq(pred)
0.668069 93.79% 91.46% 86.02%
Analysis of Variance
Source DF Adj SS Adj MS F-Value P-Value
Model 3 53.894 17.9646 40.25 0.000
Linear 2 44.915 22.4576 50.32 0.000
OrderSystem 1 28.768 28.7680 64.46 0.000
Pack 1 16.147 16.1472 36.18 0.000
minitab.com 43
Getting Started with Minitab Statistical Software
2-Way Interactions 1 8.979 8.9787 20.12 0.002
OrderSystem*Pack 1 8.979 8.9787 20.12 0.002
Error 8 3.571 0.4463
Total 11 57.464
Regression Equation in Uncoded Units
Hours = 12.573 + 1.548 OrderSystem - 1.160 Pack + 0.865 OrderSystem*Pack
Alias Structure
Factor Name
A OrderSystem
B Pack
Aliases
I
A
B
AB
You fit the full model, which includes the two main effects and the 2-way interaction. Effects are statistically significant
when their p-values in the Coded Coefficients table are less than α. At the default α of 0.05, the following effects are
significant:
•
The main effects for the order-processing system (OrderSystem) and the packing procedure (Pack)
•
The interaction effect of the order-processing system and the packing procedure (OrderSystem*Pack)
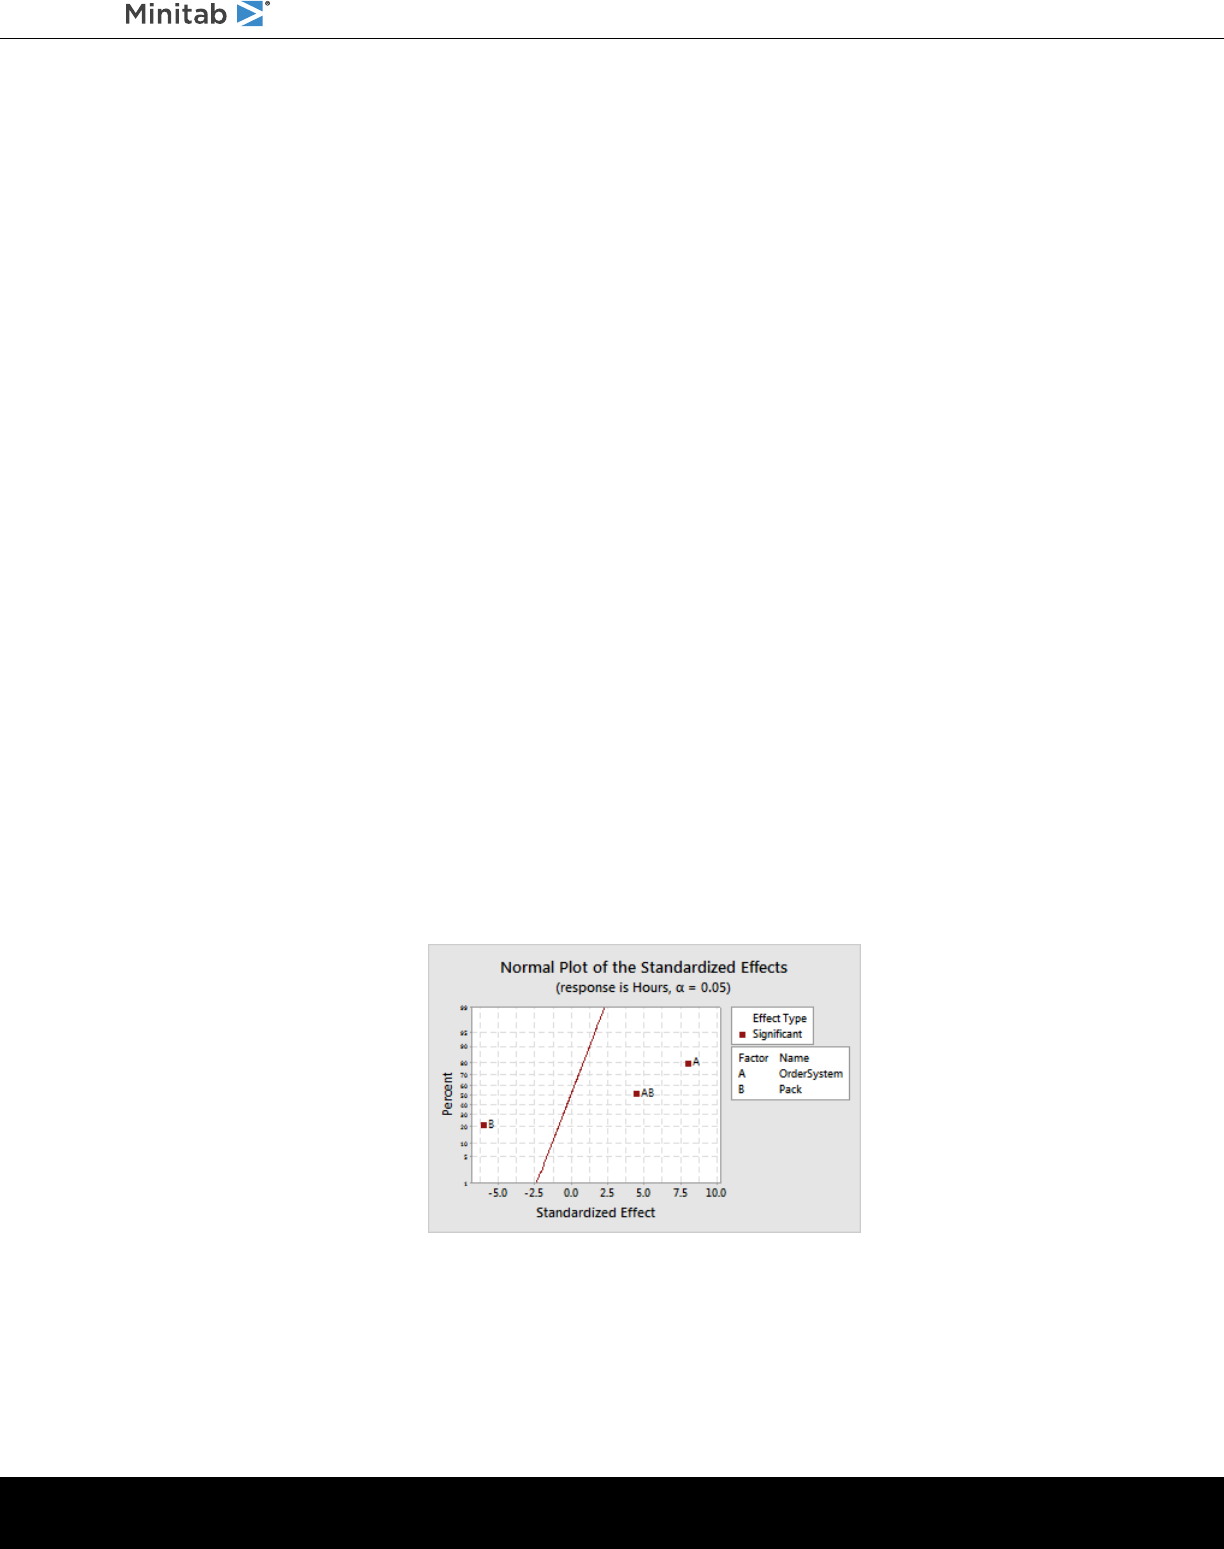
Interpret the effects plots
You can also evaluate the normal probability plot and the Pareto chart of the standardized effects to see which effects
influence the response, Hours.
Square symbols identify significant terms. OrderSystem (A), Pack (B), and OrderSystem*Pack (AB) are significant
because their p-values are less than the α of 0.05.
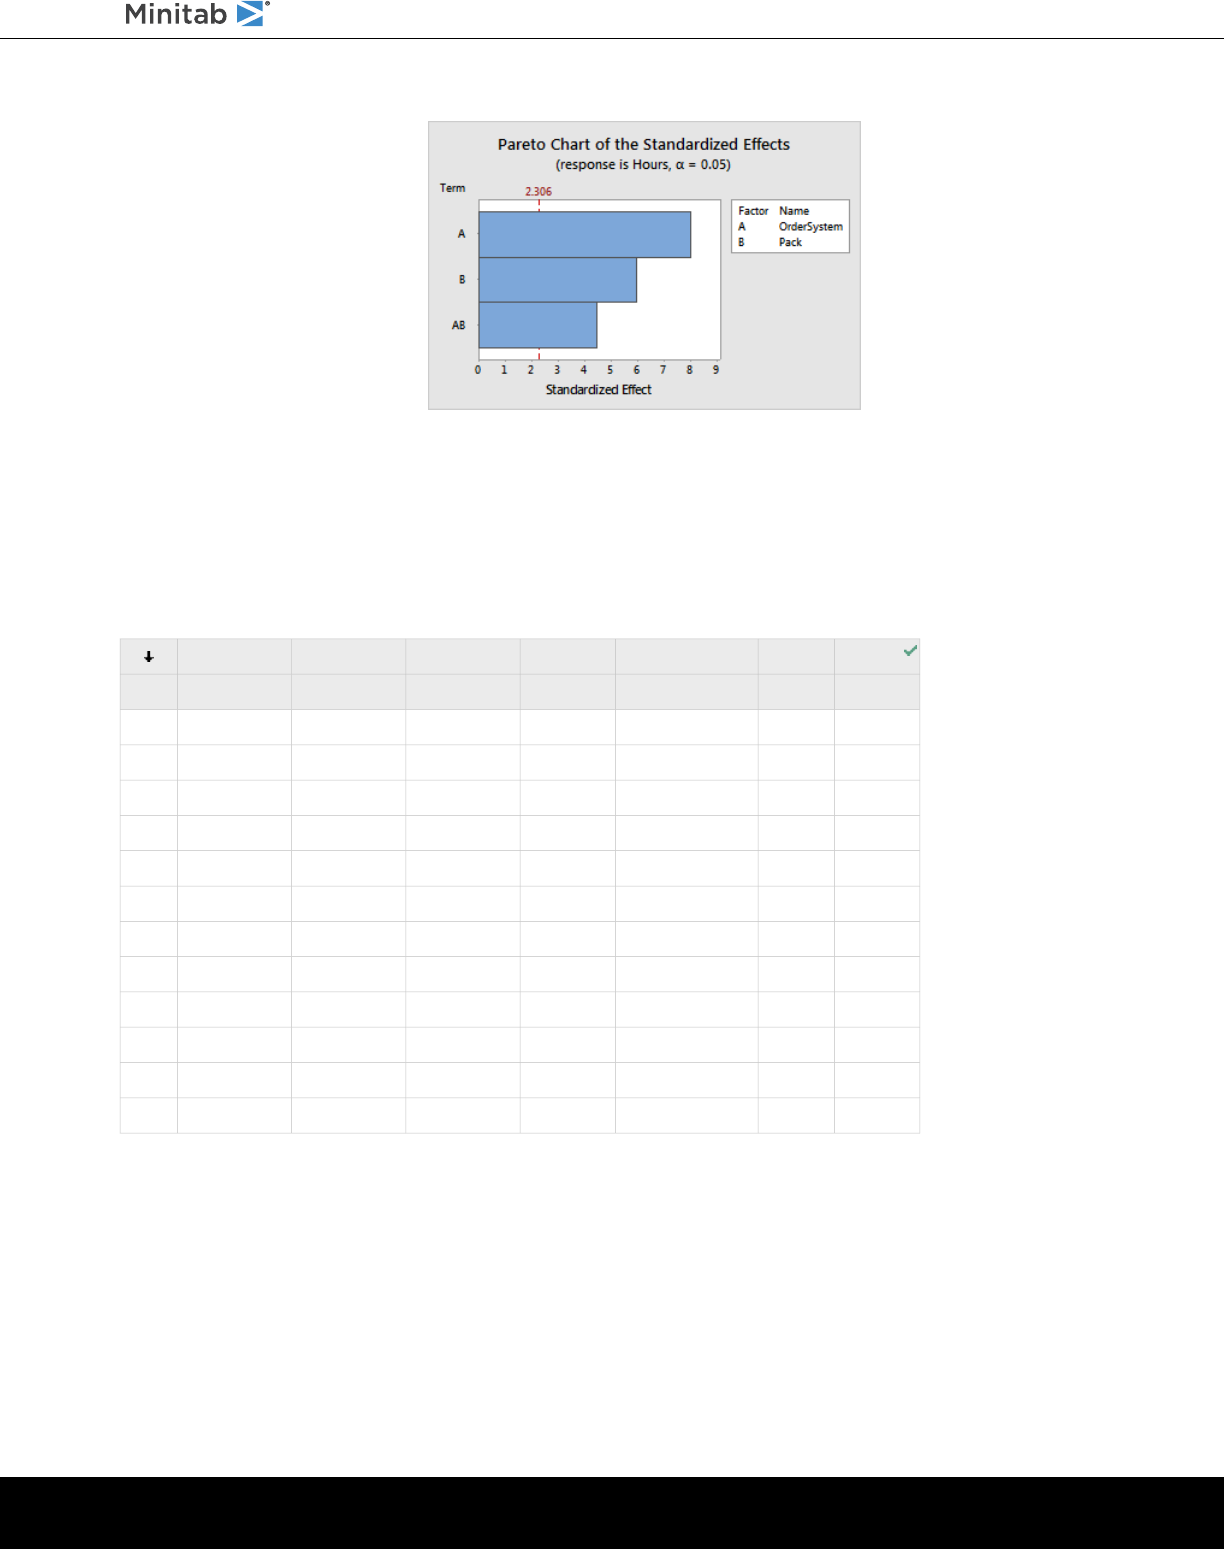
Minitab displays the absolute value of the effects on the Pareto chart. Any effects that extend beyond the reference
line are significant. OrderSystem (A), Pack (B), and OrderSystem*Pack (AB) are all significant.
minitab.com 44
Getting Started with Minitab Statistical Software
Use the stored model for additional analyses
You identified a model that includes the significant effects, and Minitab stored the model in the worksheet. A check mark
in the heading of the response column indicates that a model is stored and it is up to date. Hold the pointer over the
check mark to view a summary of the model.
C7C6-TC5-TC4C3C2C1
HoursPackOrderSystemBlocksCenterPtRunOrderStdOrder
14.72ACurrent11121
9.62BNew112112
13.81BCurrent11343
7.97BNew11434
12.52ANew11515
13.78BCurrent116126
14.64ACurrent117107
9.41BNew11878
13.89ACurrent11969
13.89BCurrent1110810
12.57ANew1111511
14.06ANew1112912
You can use the stored model to perform additional analyses to better understand your results. Next, you create factorial
plots to identify the best factor settings, and you use Minitab's Predict analysis to predict the number of hours for those
settings.
Create factorial plots
You use the stored model to create a main effects plot and an interaction plot to visualize the effects.
1. Choose Stat > DOE > Factorial > Factorial Plots.
minitab.com 45
Getting Started with Minitab Statistical Software
2. Verify that the variables, OrderSystem and Pack, are in the Selected box.
3. Click OK.
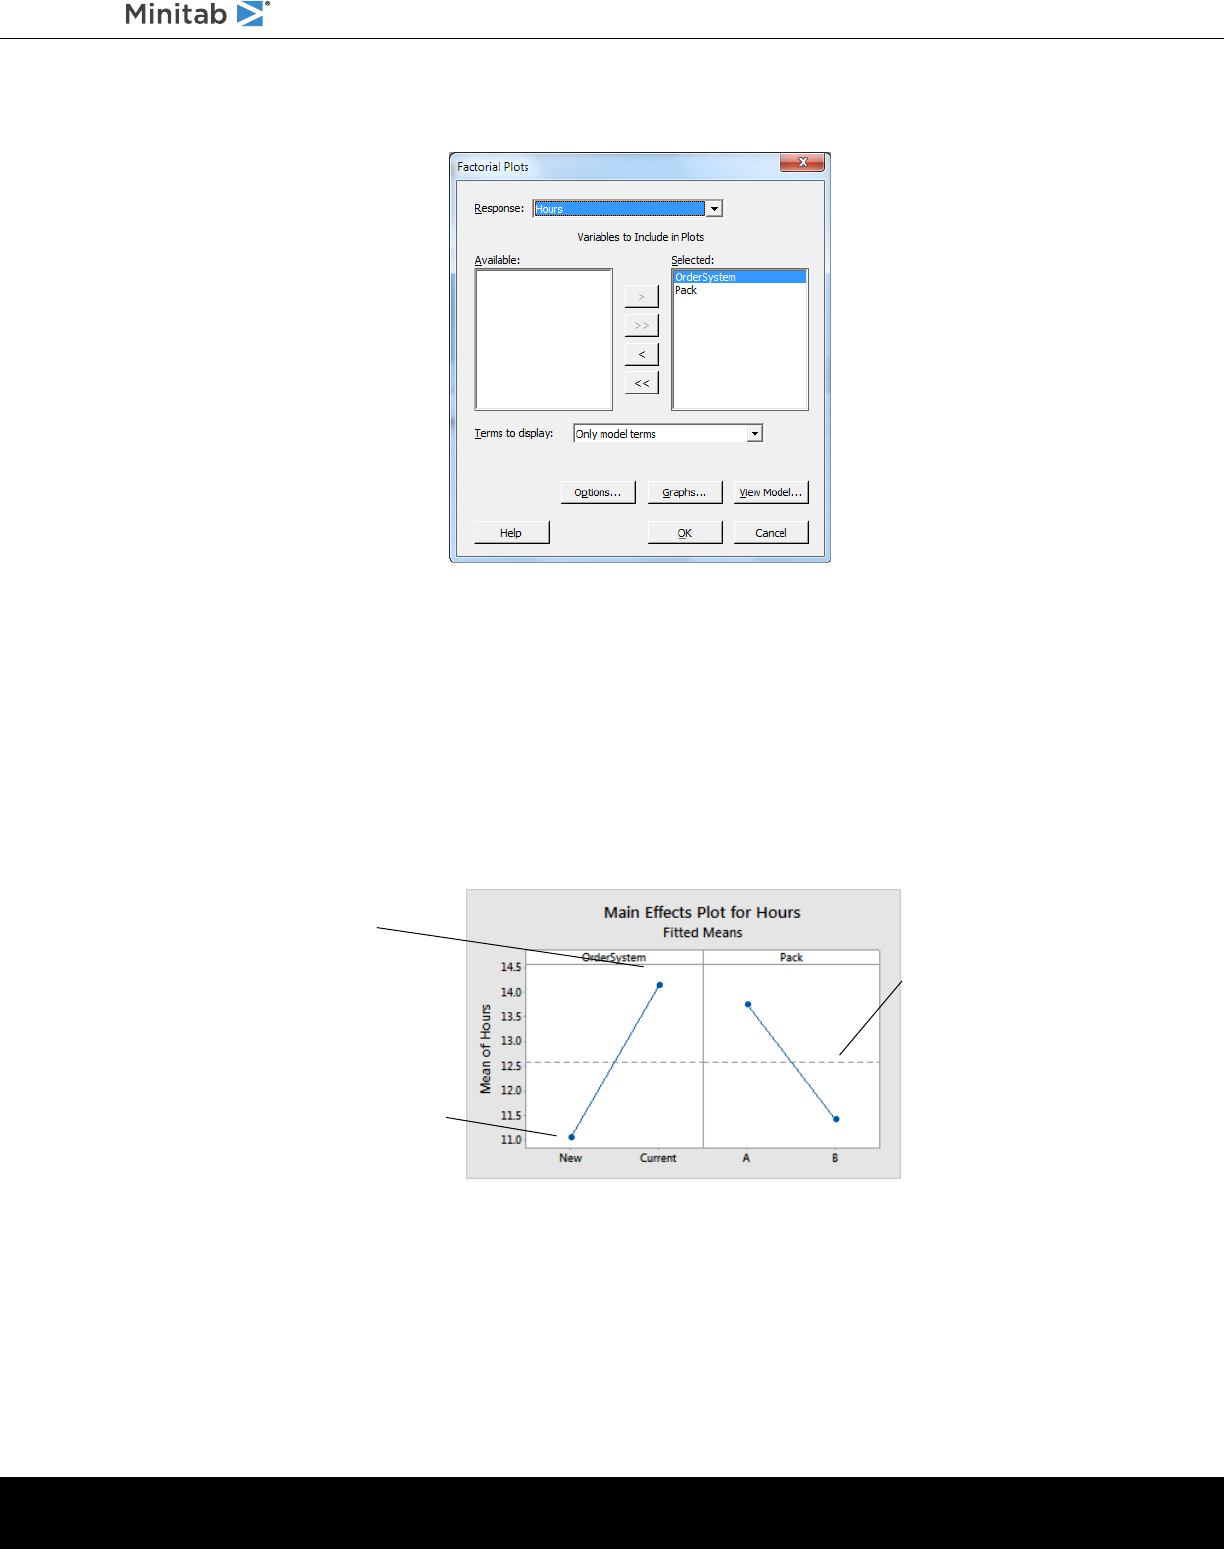
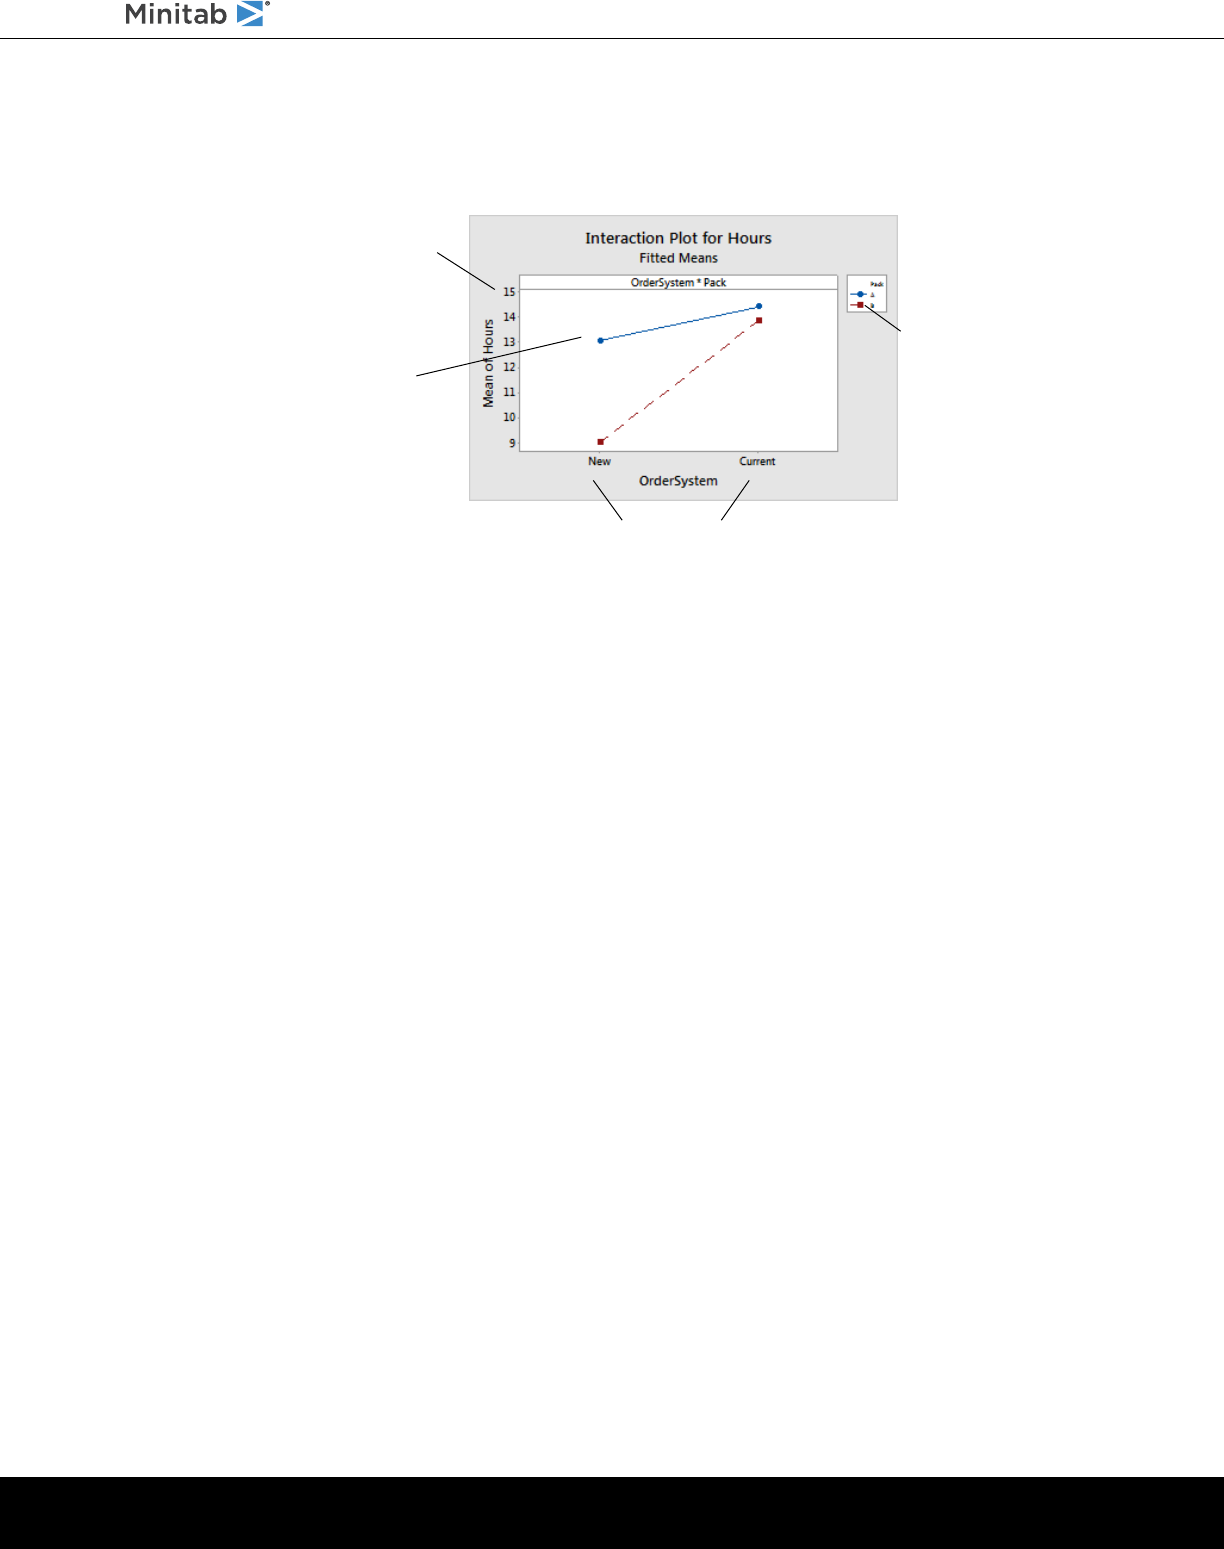
Interpret the factorial plots
The factorial plots include the main effects plot and the interaction plot. A main effect is the difference in the mean
response between two levels of a factor. The main effects plot shows the means for Hours using both order-processing
systems and the means for Hours using both packing procedures. The interaction plot shows the impact of both factors,
order-processing system and packing procedure, on the response. Because an interaction means that the effect of one
factor depends on the level of the other factor, assessing interactions is important.
This line shows
the mean for all
runs in the
experiment.
This point shows the
mean for all runs that
used the current order-
processing system.
This point shows the mean for
all runs that used the new order-
processing system.
Each point represents the mean processing time for one level of a factor. The horizontal center line shows the mean
processing time for all runs. The left panel of the plot indicates that orders that were processed using the new
order-processing system took less time than orders that were processed using the current order-processing system. The
right panel of the plot indicates that orders that were processed using packing procedure B took less time than orders
that were processed using packing procedure A.
minitab.com 46
Getting Started with Minitab Statistical Software
If there were no significant interactions between the factors, a main effects plot would adequately describe the relationship
between each factor and the response. However, because the interaction is significant, you should also examine the
interaction plot. A significant interaction between two factors can affect the interpretation of the main effects.
The vertical scale (y-axis) is in
units of the response (Hours).
This point is the mean
time needed to prepare
packages using the new
order-processing system
and packing procedure A.
The legend
displays the
levels of the
factor, Pack.
The horizontal scale (x-axis) shows the
levels of the factor, OrderSystem.
Each point in the interaction plot shows the mean processing time at different combinations of factor levels. If the lines
are not parallel, the plot indicates that there is an interaction between the two factors. The interaction plot indicates that
book orders that were processed using the new order-processing system and packing procedure B took the fewest
hours to prepare (9 hours). Orders that were processed using the current order-processing system and packing procedure
A took the most hours to prepare (approximately 14.5 hours). Because the slope of the line for packing procedure B is
steeper, you conclude that the new order-processing system has a greater effect when packing procedure B is used
instead of packing procedure A.
Based on the results of the experiment, you recommend that the Western shipping center use the new order-processing
system and packing procedure B to decrease the time to deliver orders.
Predict the response
You determined the best settings, which are stored in the DOE model in the worksheet. You can use the stored model
to predict the processing time for these settings.
1. Choose Stat > DOE > Factorial > Predict.
2. Under OrderSystem, select New.
minitab.com 47
Getting Started with Minitab Statistical Software
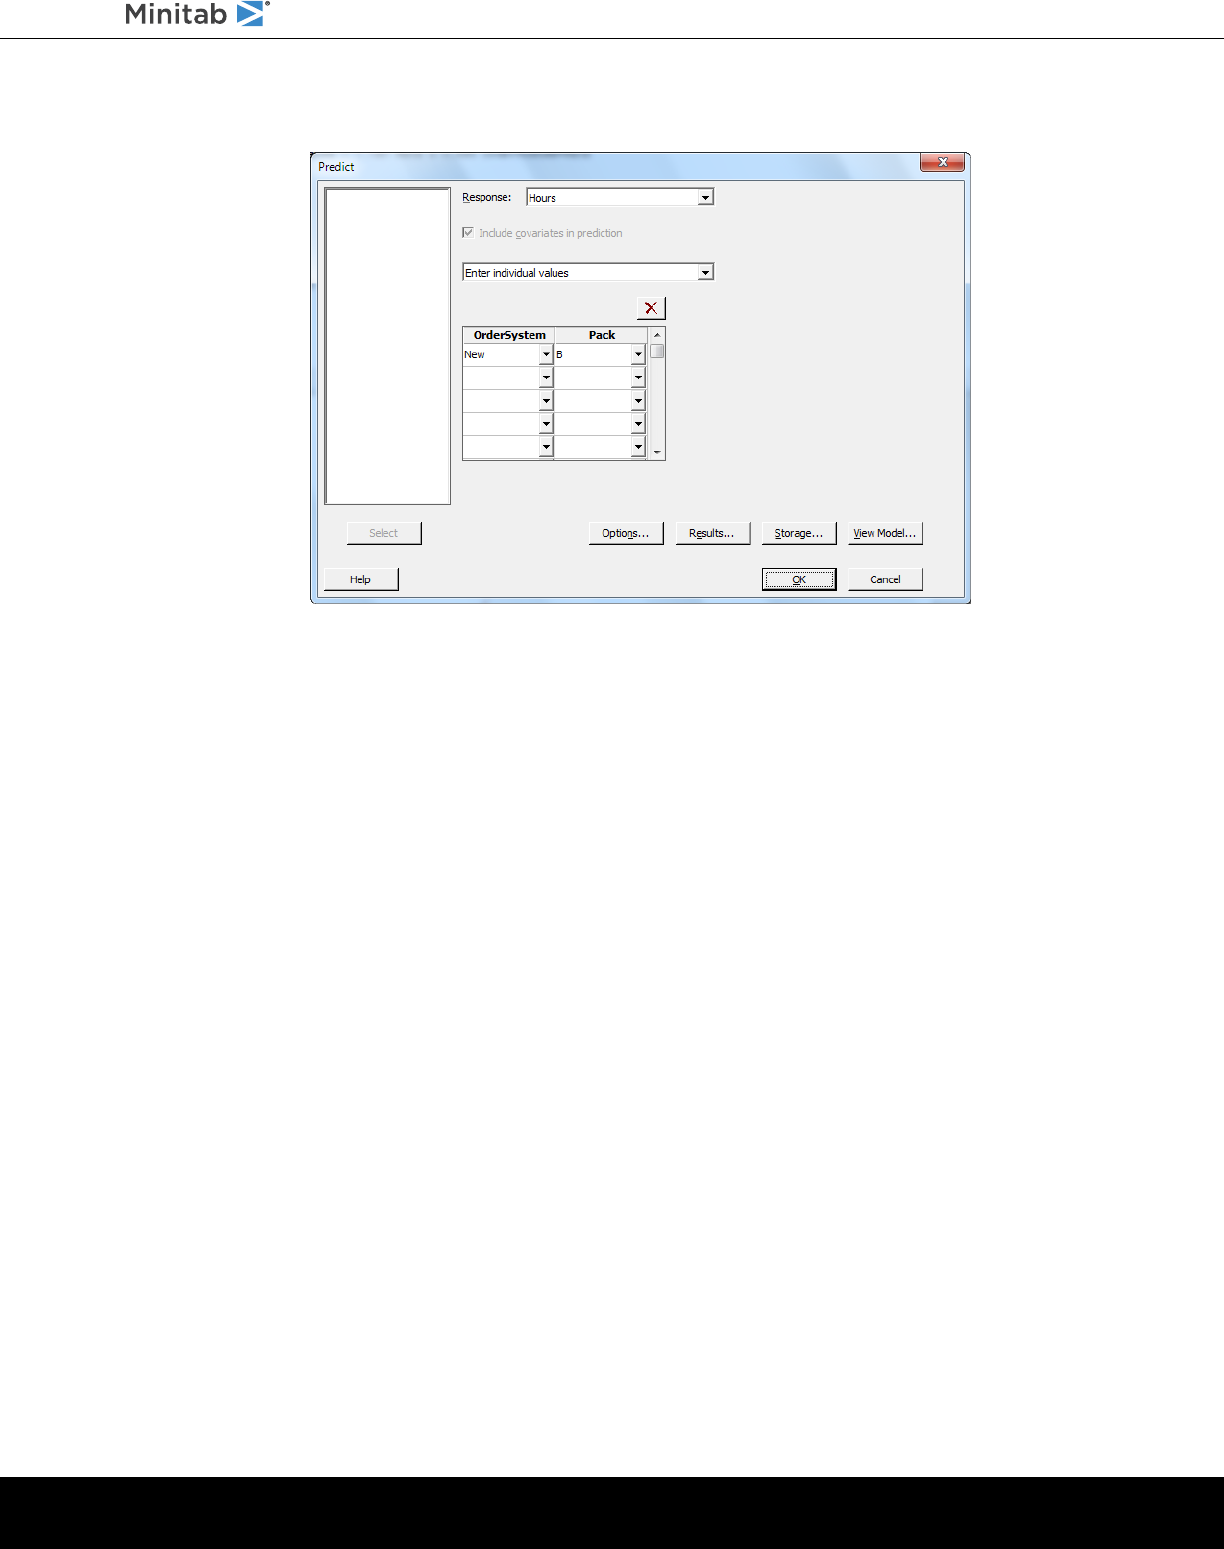
3. Under Pack, select B.
4. Click OK.
Prediction for Hours
Regression Equation in Uncoded Units
Hours = 12.573 + 1.548 OrderSystem - 1.160 Pack + 0.865 OrderSystem*Pack
Variable Setting
OrderSystem New
Pack B
Fit SE Fit 95% CI 95% PI
9 0.385710 (8.11055, 9.88945) (7.22110, 10.7789)
Interpret the results
The output displays the model equation and the variable settings. The fitted value (also called predicted value) for these
settings is 9 hours. However, all estimates contain uncertainty because they use sample data. The 95% confidence interval
is the range of likely values for the mean preparation time. If you use the new order-processing system and packing
procedure B, you can be 95% confident that the mean preparation time for all orders will be between 8.11 and 9.89 hours.
Save the project
1. If you have not already saved your project, choose File > Save Project.
2. Browse to where you want to save your project.
3. Name your project MyDOE.
4. Click Save.
minitab.com 48
Getting Started with Minitab Statistical Software

In the next chapter
The factorial experiment indicates that you can decrease the time that is needed to prepare orders at the Western shipping
center by using the new order-processing system and packing procedure B. In the next chapter, you learn how to use
command language and create and run exec files to quickly re-run an analysis when new data are collected.
minitab.com 49
Getting Started with Minitab Statistical Software
6. Repeat an Analysis
Overview
Note: When you use the web app, click Open in Desktop App to complete the tasks in this chapter.
When you use a menu command in Minitab, Minitab preserves session commands that record your actions. You can use
these session commands to quickly repeat an analysis on a new set of data.
Each menu command has a corresponding session command. Session commands consist of a main command and,
usually, one or more subcommands. Main commands and subcommands can be followed by a series of arguments, which
can be columns, constants, matrices, text strings, or numbers. Minitab provides three ways to use session commands:
•
Enter session commands in the Command Line pane.
•
Copy session commands from the History pane to the Command Line pane.
•
Copy and save session commands in an exec file.
When you view the Command Line/History pane, and then execute a command from a menu, the corresponding session
commands are displayed in the History pane. This technique is a convenient way to learn session commands.
The Western shipping center continuously collects and analyzes delivery times when new data are available. In Assessing
Quality on page 30, you conducted a capability analysis on data from March. In this chapter, you use session commands
to perform a capability analysis on data from April.
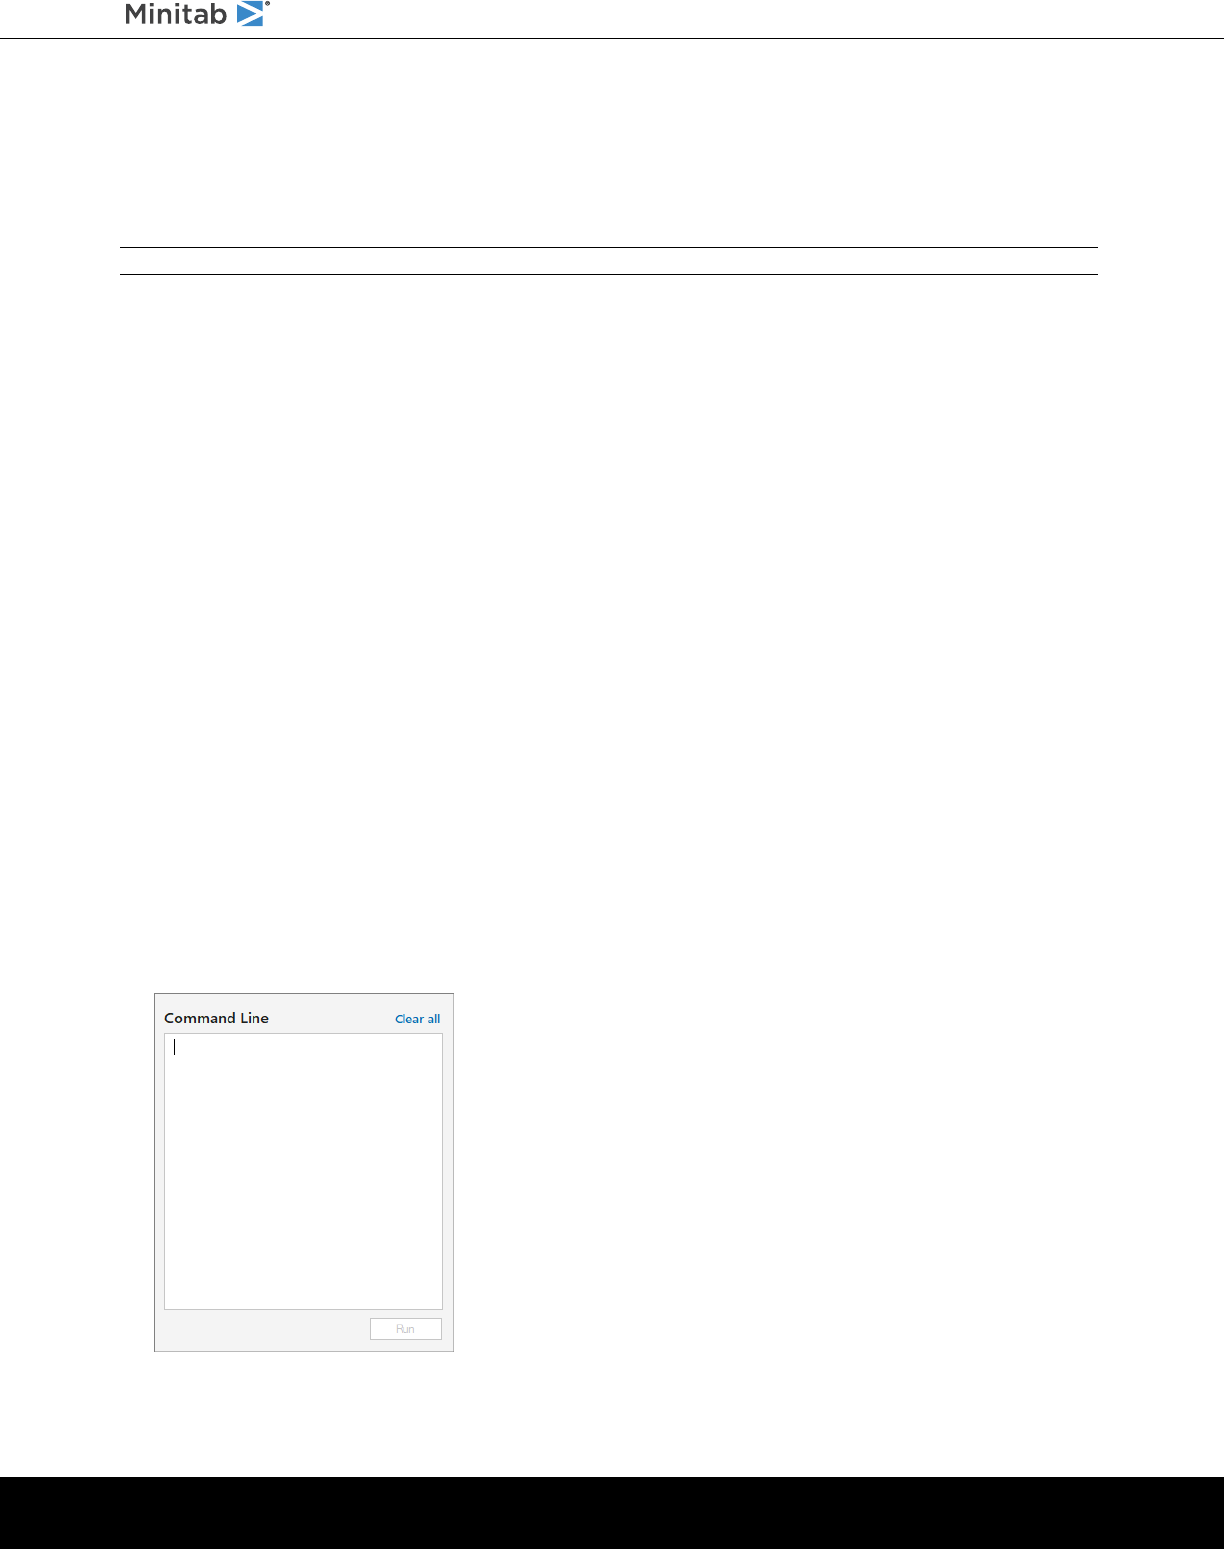
Perform an analysis using session commands
One way to use session commands is to enter them in the Command Line pane. Minitab does not display the pane by
default, so you must enable it.
View the Command Line pane
1. If you are continuing from the previous chapter, choose File > New > Project. If not, start Minitab.
2. Open the data set, SessionCommands.MTW.
3. Choose View > Command Line/History.
minitab.com 50
Getting Started with Minitab Statistical Software
Enter session commands
In Assessing Quality on page 30, you performed a capability analysis to determine whether delivery times were within
specifications (less than 6 delivery days). To perform this analysis, you used Stat > Quality Tools > Capability Analysis
> Normal. Then, you entered the data column, the subgroup column, and the upper specification limit.
To continue assessing the delivery times at the Western shipping center, you plan to repeat this analysis at regular
intervals. When you collect new data, you can repeat this analysis using a few session commands.
1. In the Command Line pane, enter Capability 'Days' 'Date';
The semicolon indicates that you want to enter a subcommand.
2. Press Enter.
3. Enter USPEC 6.
The period indicates the end of a command sequence.
4. Click Run.
The contents of the Command Line pane are not cleared after commands are run. Choose Clear All in the top right
to clear the contents of the pane.
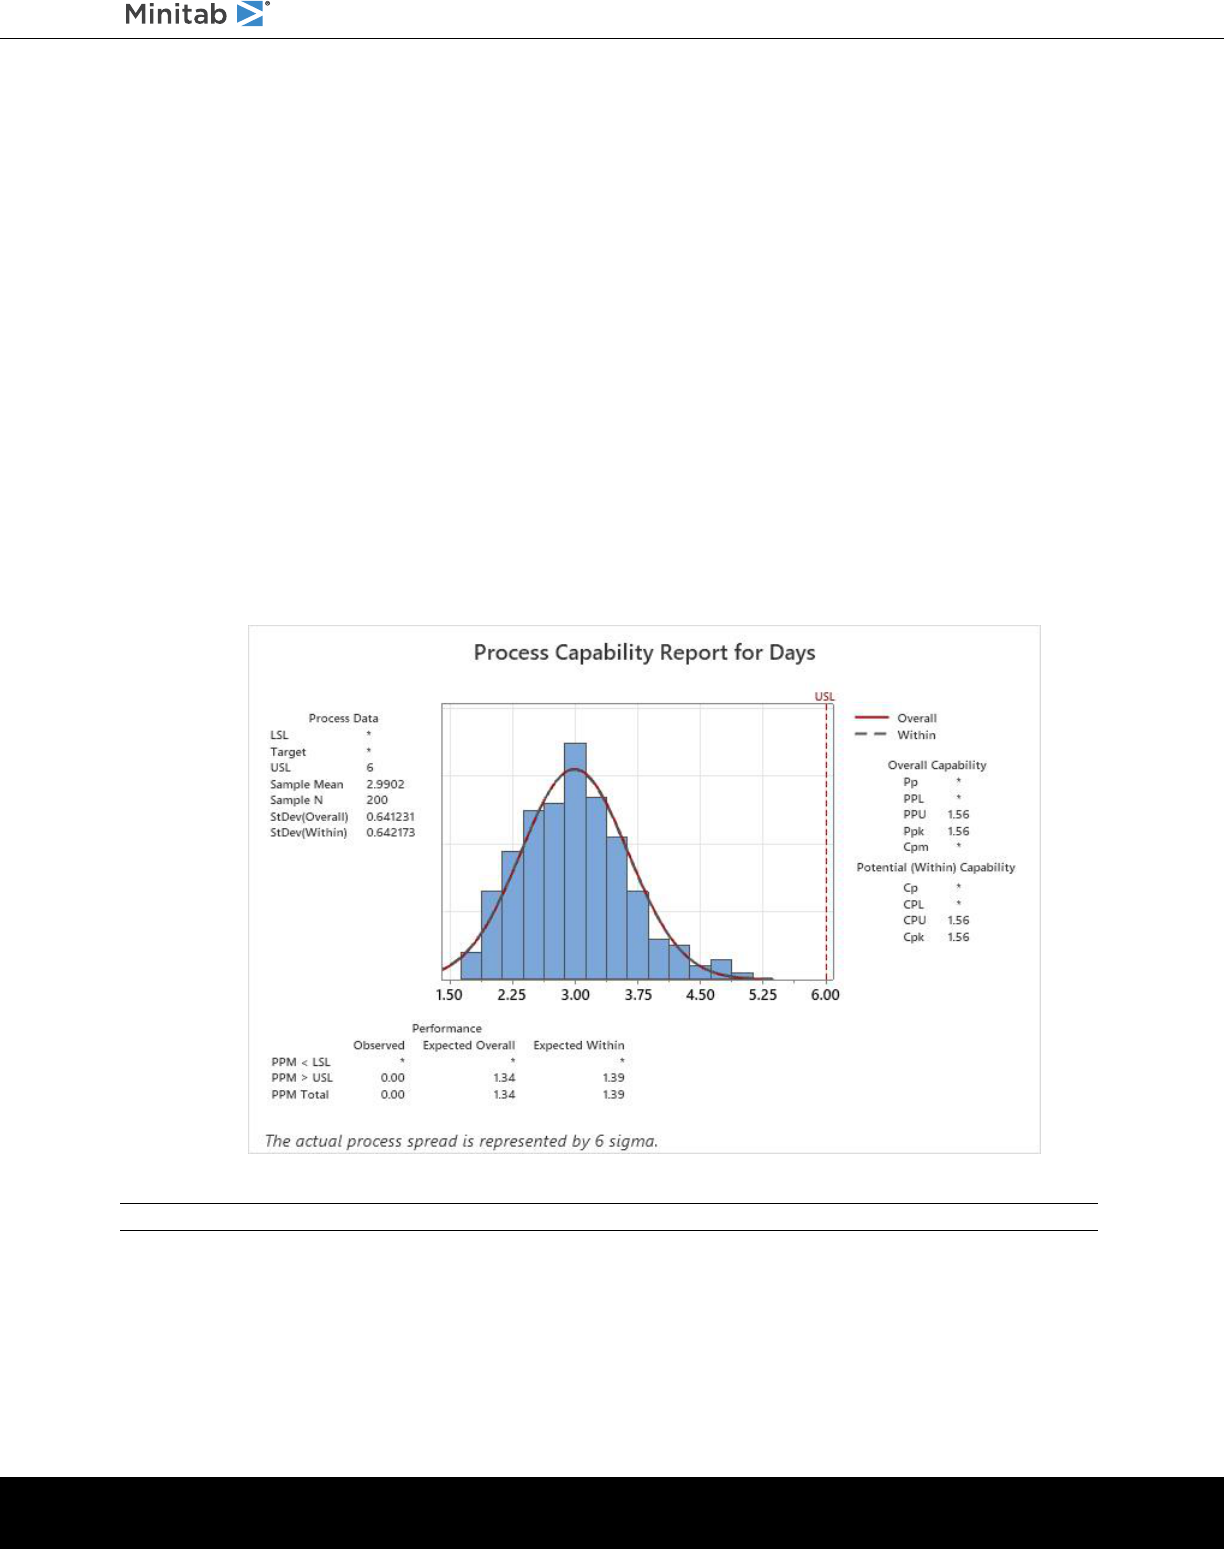
Capability analysis for the April shipping data
Tip: To open a PDF file that lists the session commands in Minitab, in the Command Line pane, enter Help, then click Run.
Copy session commands
Minitab generates session commands for most menu commands and stores them in the History pane. You can rerun
these commands by selecting them and clicking Copy to Command Line.
1. In the Command Line pane, click Clear All.
minitab.com 51
Getting Started with Minitab Statistical Software
2. In the History pane, double-click Capability 'Days' 'Date' to select the command and subcommand.
3. Click Copy to Command Line.
4. Click Run.
Capability analysis for the April shipping data
You have re-created the capability analysis using the commands from the History pane.
Use an exec file to repeat the analysis
An exec file is a text file that contains a series of Minitab commands. To repeat an analysis without using menu commands
or session commands, save the commands as an exec file and then run the exec file.
Create an exec file from the History pane
Save the session commands for the capability analysis as an exec file.
1. In the History pane, double-click Capability 'Days' 'Date' to select the command and subcommand.
2. Right-click the selected commands and choose Copy.
3. Open a text editor, such as Notepad.
4. Paste the commands into the text editor.
5. Save the text file with the name and extension ShippingGraphs.mtb.
Rerun commands
You can repeat this analysis by running the exec file.
minitab.com 52
Getting Started with Minitab Statistical Software
1. Choose File > Run an Exec.
2. Click Select File.
3. Select the file, ShippingGraphs.MTB, then click Open.
Capability analysis for the April shipping data
Minitab runs the commands in the exec file to generate the capability analysis.
You can run an exec file using any worksheet if the column names match. Therefore, you can share an exec file with
other Minitab users who need to perform the same analysis. For example, the manager of the Western shipping center
can share ShippingGraphs.MTB with the managers of the other shipping centers so that they can perform the same
analysis on their own data. If you want to use an exec file with a different worksheet or with different columns, edit the
exec file using a text editor.
Save the project
Save all your work in a Minitab project.
1. If you have not already saved your project, choose File > Save Project.
2. Browse to where you want to save your project.
3. Name your project MySessionCommands.
4. Click Save.
minitab.com 53
Getting Started with Minitab Statistical Software

In the next chapter
You learned how to use session commands as an alternative to menu commands and as a way to quickly repeat an
analysis. In the next chapter, you enter data in a worksheet from multiple sources. Also, to prepare the data and simplify
the analysis, you edit the data and reorganize columns and rows.
minitab.com 54
Getting Started with Minitab Statistical Software

7. Importing and Preparing Data
Overview
Frequently, you use worksheets that are already created for you. However, sometimes you must enter or import data
into a Minitab worksheet before you start an analysis.
You can enter data in a Minitab worksheet in the following ways:
•
Type the data directly into the worksheet.
•
Copy and paste the data from other applications.
•
Import the data from Microsoft
®
Excel files or text files.
After your data are in Minitab, you might need to edit cells or reorganize columns and rows to prepare the data for analysis.
Some common data manipulations are stacking, subsetting, specifying column names, and editing data values.
In this chapter, you import data into Minitab from different sources. You also learn how ShippingData.MTW was prepared
for analysis.
Import data from different sources
For the initial analyses in Getting Started with Minitab Statistical Software, the worksheet ShippingData.MTW, which
contains data from three shipping centers, is already set up. However, the three shipping centers originally stored the
shipping data in the following ways:
•
The Eastern shipping center stored data in a Minitab worksheet.
•
The Central shipping center stored data in a Microsoft
®
Excel file.
•
The Western shipping center stored data in a text file.
To analyze all of the shipping data, open each file in Minitab, then stack the files into one worksheet.
Open a worksheet
Start with the data from the Eastern shipping center.
•
Open the data set, Eastern.MTW.
Open data from an Excel spreadsheet
The Central shipping center data are in an Excel spreadsheet. You can open Excel files in Minitab.
Note: In the web app, you can open .xlsx files, but you cannot open .xls and .xml files.
1. Save the data set, Central.xlsx.
2. Choose File > Open.
3. Browse to the folder where you saved the data set.
4. Select Central.xlsx.
5. Click OK.
minitab.com 55
Getting Started with Minitab Statistical Software

Open data from a text file (*.txt)
The Western shipping center data was in a text file. Open the text file.
1. Save the data set, Western.txt.
2. Choose File > Open.
3. Browse to the folder where you saved the data set.
4. Select Western.txt.
5. Click OK.
Combine the data into one worksheet
Notice that the worksheets for the shipping centers have the same column names. To make the data easier to analyze,
you need to combine the data into one worksheet by stacking columns that have the same names. You can move data
by copying and pasting or by using commands on the Data menu.
1. Choose Data > Stack Worksheets.
2. From Stack option, select Stack worksheets in a new worksheet.
3. Use the arrow buttons to move the three worksheets from Available worksheets to Worksheets to stack.
4. In New worksheet name, enter MyShippingData.
5. Click OK.
minitab.com 56
Getting Started with Minitab Statistical Software
Move and rename a column
The column Source contains the labels that identify data from the shipping centers. Move the Source column to C1, and
rename the column Center.
Note: When you use the web app, click Open in Desktop App to complete the following steps.
1. Click in the Source column, then right-click and choose Move Columns.
2. Under Move Selected Columns, select Before column C1.
3. Click OK.
4. Click the column name, Source, enter Center, and press Enter.
Prepare the data for your analysis
Now that the data are in a single worksheet, you can prepare the data, or manipulate it, to work for your specific analysis.
For example, you can recode the data or create a column of calculated values.
Tip: For more information on data manipulations in Minitab, go to Manipulate Data in Worksheets, Columns, and Rows.
Recode the data
The labels in the Center column do not adequately identify which center the data are from. Recode the labels to remove
the file extension.
1. Choose Data > Recode > To Text.
2. In Recode values in the following columns, enter Center.
3. In Method, select Recode individual values.
4. Under Recoded value, replace Eastern.MTW with Eastern.
5. Under Recoded value, replace Western.txt with Western.
minitab.com 57
Getting Started with Minitab Statistical Software
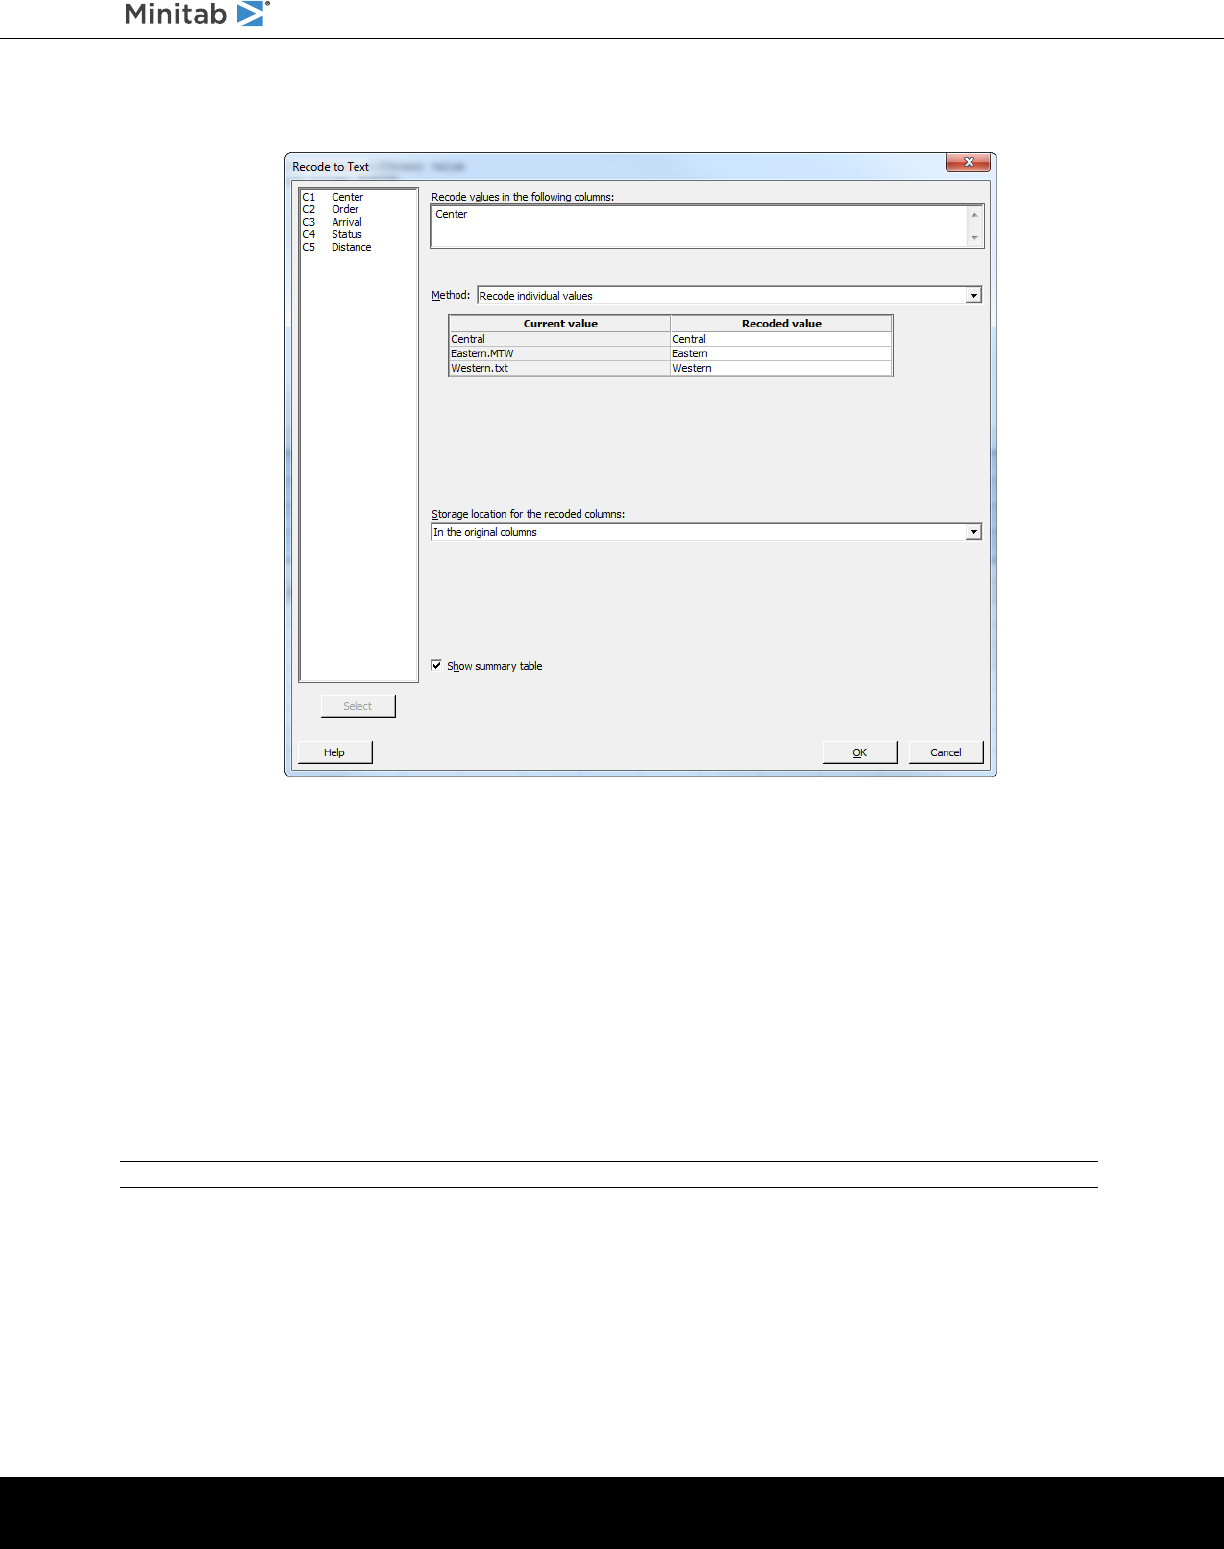
6. From Storage location for the recoded columns select In the original columns.
7. Click OK.
The labels in the Center column are now Central, Eastern, and Western.
Create a column of calculated values
Before you save your new worksheet and perform analyses, you need to calculate the number of days that elapsed
between order dates and delivery dates. You can use Minitab’s Calculator to assign a formula to a column to calculate
these values. If you change or add data, the calculated values are automatically updated.
Insert a column
Insert a column between Arrival and Status.
Note: When you use the web app, click Open in Desktop App to complete the following steps.
1. Click any cell in C4 to make that column active.
2. Right-click, then choose Insert Columns.
3. Click in the name cell of C4. Type Days, then press Enter.
minitab.com 58
Getting Started with Minitab Statistical Software
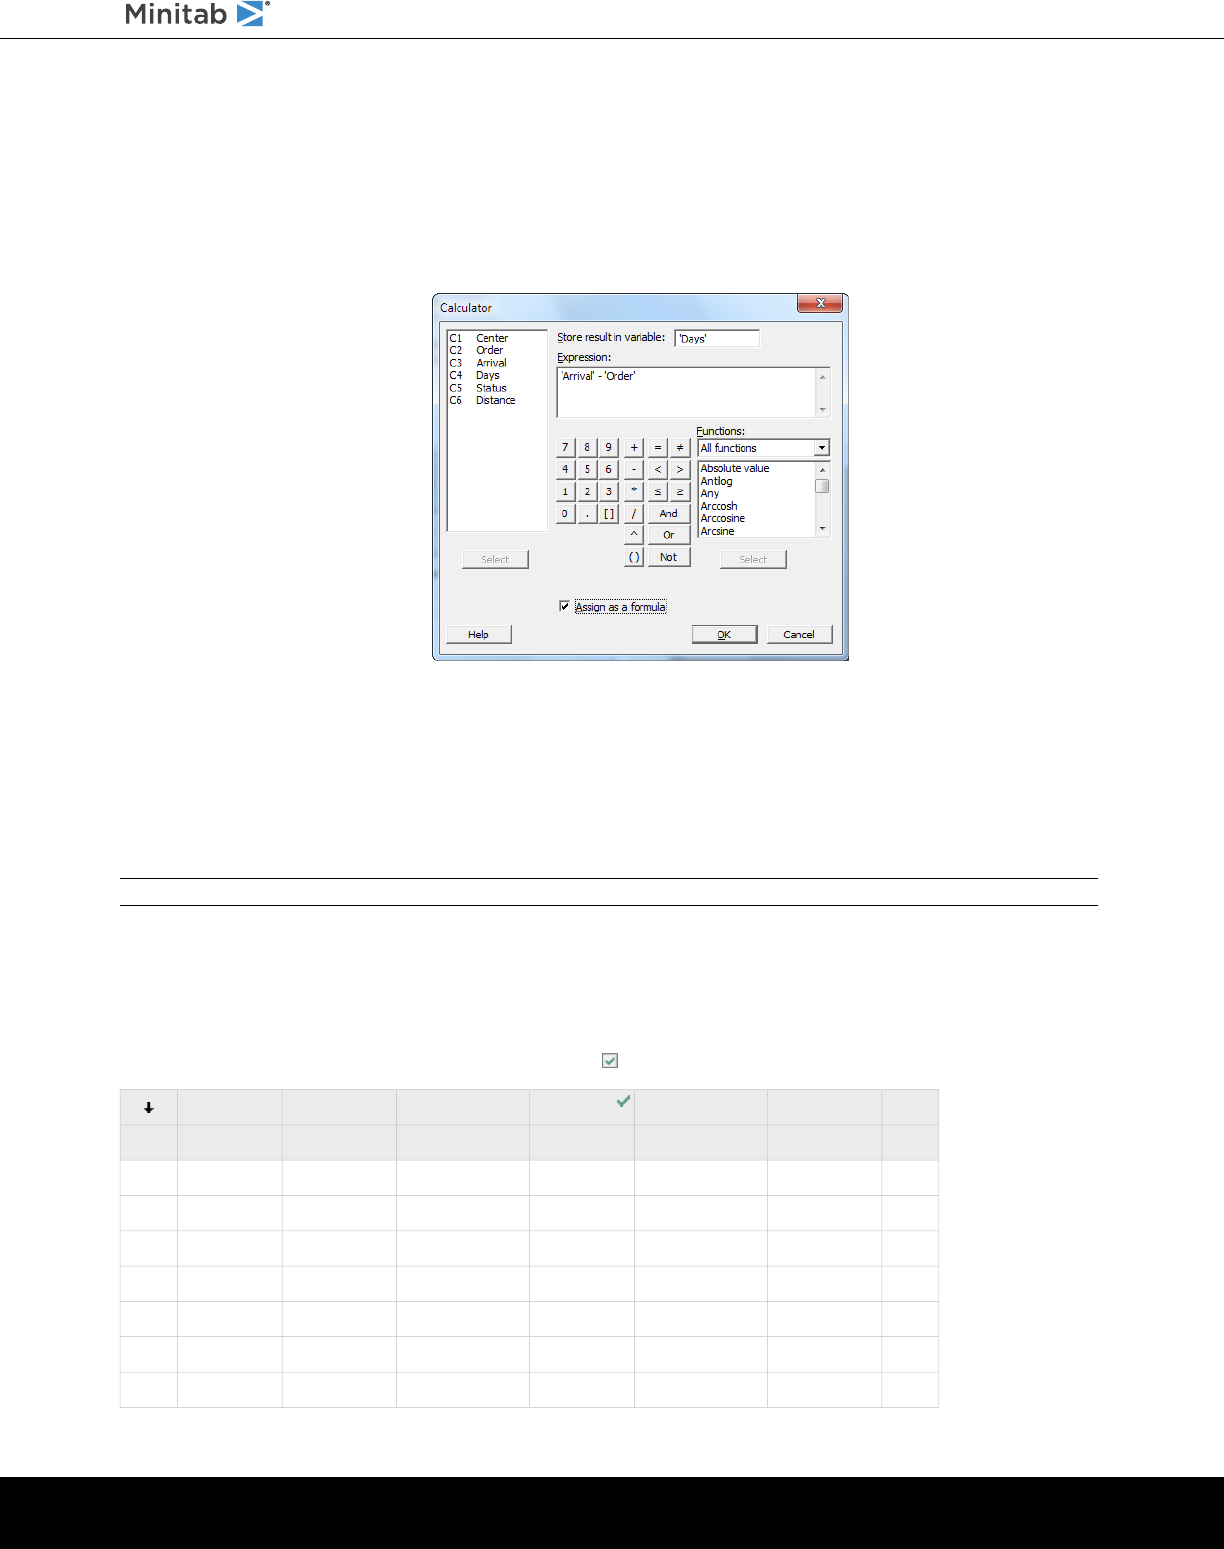
Assign a formula to a column
Use Minitab’s Calculator to perform basic arithmetic or mathematical functions. Minitab stores the results in a column or
a constant. You can assign a formula to a column so that the calculated values update automatically if the data change.
Calculate the delivery time and store the values in the Days column.
1. Choose Calc > Calculator.
2. In Store result in variable, enter Days.
3. In Expression, enter Arrival - Order.
4. Select Assign as a formula.
5. Click OK.
Tip: You can also add a formula to a column by right-clicking the column and choosing Formulas > Assign Formula to Column.
Examine the worksheet
The Days column contains the calculated values that represent delivery time. These values are expressed in number of
days. When you assign a formula to a column, a status indicator appears in the upper right corner of the column heading
on the worksheet. This indicator specifies whether the formula is properly defined and whether the data need to be
updated by re-calculating the values. A green check mark indicates the data are up-to-date.
C7C6C5-TC4C3-DC2-DC1-T
DistanceStatusDaysArrivalOrderCenter
255On time4.282643/8 15:213/4 8:34Eastern1
196On time3.354173/7 17:053/4 8:35Eastern2
299Back order**3/4 8:38Eastern3
205On time4.300003/8 15:523/4 8:40Eastern4
250Late6.254173/10 14:483/4 8:42Eastern5
93On time5.293063/9 15:453/4 8:43Eastern6
189On time4.050003/8 10:023/4 8:50Eastern7
minitab.com 59
Getting Started with Minitab Statistical Software
C7C6C5-TC4C3-DC2-DC1-T
DistanceStatusDaysArrivalOrderCenter
335On time5.315973/9 16:303/4 8:55Eastern8
211On time5.065283/9 10:323/4 8:58Eastern9
254On time4.285423/8 16:023/4 9:11Eastern10
Tip: Hold the pointer over the status indicator to view the formula assigned to the column. Double-click the status indicator to edit the formula.
When data values change
Suppose you learn that the arrival date for a shipment in the Central shipping region is incorrect. If you correct the date
in the worksheet, Minitab automatically updates the Days column, which contains the formula that calculates elapsed
time.
Change the arrival date in row 127.
1. In the Arrival column, right-click and choose Find and Replace > Go To, then enter row number 127.
2. In the cell, change 3/7 9:17 to 3/8 9:17.
3. Press Enter.
Minitab automatically updates the value in the Days column from 2.98125 to 3.98125.
Note: To update formulas manually, right-click the column that contains the formula and choose Formulas > Calculate All Formulas
Automatically to deselect this option. If values in the worksheet change and cause the formula in a column to be out of date, the status indicator
for that column changes to a yellow triangle. Right-click the column that contains the formula and choose Formulas > Calculate All Formulas
Now to update all formulas in the project.
Save the worksheet
Save all your work in a Minitab worksheet.
Note: When you use the web app, click Open in Desktop App to complete the following steps.
1. Click in the worksheet, then choose File > Save Worksheet As.
2. Browse to where you want to save your worksheet.
3. Name the worksheet MyShippingData.
4. From Save as type, select Minitab.
5. Click Save.
minitab.com 60
Getting Started with Minitab Statistical Software

Index
A
adding data to a worksheet 32
analysis of variance 23
analyzing data 21
annotating graph layout 18
ANOVA 23
arithmetic functions 59
arrow, data-entry direction 33
assessing quality 30
assigning formulas to a column 59
Assistant 13
Autofill 33
automating an analysis 52
B
boxplot 24, 27
built-in graphs 8, 21
generating 24
C
calculating formulas 59
Calculator 59
capability analysis 35
coding data 57
columns 7
assigning formulas 59
inserting 58
moving 57
number 7
renaming 57
Command Line pane 6, 50, 51
confidence intervals 26
control charts 30, 32
editing x-axis labels 33
stages 31
subgroups 30
updating 33
D
data
adding to a worksheet 32
analyzing 21
coding 57
importing 55
merging 55, 56
preparing 55, 57
replacing 57
types 6
data pane 6
data-entry direction arrow 33
descriptive statistics, displaying 21
design of experiments (DOE) 37
desktop app 4
Display Descriptive Statistics 21
DOE 37
E
effects plots 44
Excel, merging data into worksheet 55
Exec file 52
experimental designs 37
F
factorial designs 37
analyzing 42
creating 37
effects plots 44
entering data 41
entering factor names 39
fitting a model 42
interaction plot 45
main effects plot 45
randomizing run order 40
selecting 38
factorial plots 45
files
merging 55, 56
MPX, MPJ file type 19, 29, 36, 48, 53
MWX, MTW file type 55, 60
saving projects 19, 29, 36, 48, 53
text 56
xlsx format 55
footnote, adding to graphs 11
formula in a column 59
four-in-one residual plot 27
G
graphing data 8
graphs 8
built-in 8, 21, 24
editing 11
layout tool 16
updating 32
grouped histogram 8
interpreting 11
H
Help, accessing 29
histogram
paneled 8
paneled, interpreting 11
History pane 6, 51
hypothesis testing 23
I
individual value plot 24, 27
inserting a column 58
interaction plot 45
interval plot 24, 27
L
layout tool for graphs 16
adding annotation 18
M
macros 52
main effects plot 45
mathematical functions 59
merging files 55, 56
mixture designs 37
moving columns 57
MPX, MPJ file format 19, 29, 36, 48, 53
multiple comparison
accessing Help on 29
multiple comparison of means 23
interpreting 26
MWX, MTW file format 55, 60
N
Navigator 5
normal distribution 8
normal probability plot of effects 44
O
one-way ANOVA 23, 29
opening a worksheet 7, 55
output pane 5
P
p-value 26
pane
Command Line 6, 51
data 6
History 6, 51
output 5
paneled histogram
creating 8
interpreting 10, 11
stacking 10
Pareto chart of effects 44
minitab.com 61

plots
boxplot 24, 27
effects 44
factorial 45
individual value 24, 27
interval 24, 27
residual 25, 27
process capability 35
project files, saving 19, 29, 36, 48, 53
Q
quality, assessing 30
R
randomizing run order 40
renaming columns 57
repeating an analysis 51
replacing values in a worksheet 57
replicates 39
report 5, 19
residual plots 25
four-in-one 27
histogram of the residuals 27
normal probability plot 27
residuals versus order 27
residuals versus the fitted values 27
response surface designs 37
rows in a worksheet 7
S
saving
Execs 52
project 19, 29, 36, 48, 53
worksheet 60
scatterplot
creating 13
interpreting 14
session commands 50
enabling 50
using 50
special causes 30
specification limits 35
split view 5
stability 30
stacking worksheets 56
stages, control charts 31
status bar 6
subgroups 30
T
text files 56
Tukey test
95% confidence interval 28
accessing Help on 29
multiple comparison of means 23, 26
U
updating a formula 60
updating graphs 32
V
variables 7
entering in a dialog box 9
viewing
Command Line/History pane 6, 50
Navigator 6
output 23
W
web app 4, 8, 10, 11, 13, 16, 18, 19, 32, 33,
50, 57, 58, 60
worksheet
adding data 32
Autofill 33
entering data 32
merging data from a text file 56
merging data from Excel 55
opening 7, 55
preparing data 57
saving 60
stacking 56
X
x-axis labels 33
Xbar-S chart 30
interpreting 31
xlsx file format 55
minitab.com 62
Index
Our mission is to help people discover valuable insights in their data.
Minitab helps companies and institutions to spot trends, solve problems and discover valuable insights in data by delivering a comprehensive and best-in-class
suite of data analysis and process improvement tools. Combined with unparalleled ease-of-use, Minitab makes it simpler than ever to get deep insights from data.
Plus, a team of highly trained data analytic experts ensure that users get the most out of their analysis, enabling them to make better, faster and more accurate
decisions.
For nearly 50 years, Minitab has helped organizations drive cost containment, enhance quality, boost customer satisfaction and increase effectiveness. Thousands
of businesses and institutions worldwide use our products to uncover flaws in their processes and improve them. Unlock the value of your data with Minitab.
©
2024 by Minitab, LLC. All rights reserved.
Minitab
®
, Minitab Connect
®
, Minitab Model Ops
®
, Minitab Engage
®
, Minitab Workspace
®
, Salford Predictive Modeler
®
, SPM
®
, and the Minitab
®
logo are all registered
trademarks of Minitab, LLC, in the United States and other countries. Additional trademarks of Minitab, LLC can be found at www.minitab.com. All other marks
referenced remain the property of their respective owners.
Release 22.1
